
| Category | Nov-10 | Nov-11 | Nov-12 | Nov-13 | Nov-14 | Δ DoDvs. same cycle | Δ 7d MA |
|---|---|---|---|---|---|---|---|
| Supply / Production 62.4% Sample | 65.955 | 66.577 | 67.177 | 68.667 | 68.995 | +1.309 (+1.9%) | +0.111 (+0.2%) |
| LNG Feedgas 100.0% Sample | 19.250 | 19.338 | 19.504 | 20.218 | 20.448 | +0.213 (+1.1%) | +0.053 (+0.3%) |
| Canada Import 100.0% Sample | 6.650 | 6.777 | 6.820 | 6.665 | 6.397 | -0.203 (-3.1%) | -0.007 (-0.1%) |
| Export to Mexico 17.3% Sample | 1.034 | 1.100 | 1.106 | 1.125 | 0.973 | -0.189 (-16.3%) | -0.021 (-1.9%) |
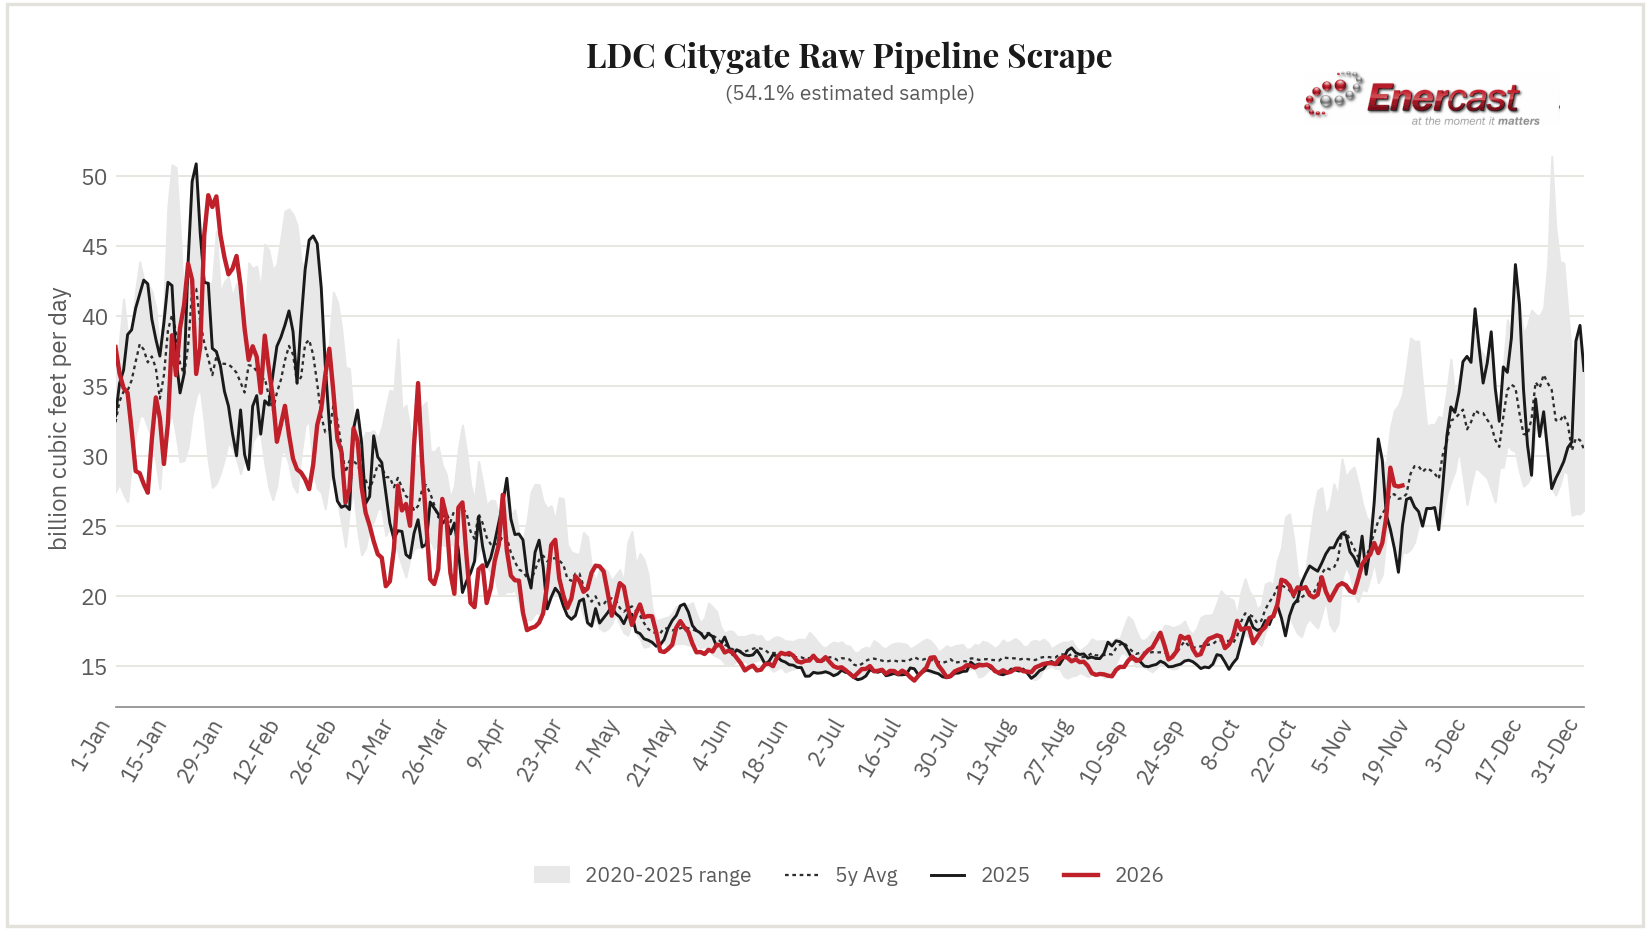
| LDC Citygate 54.1% Sample | 23.070 | 23.790 | 25.676 | 29.188 | 27.826 | -1.194 (-4.1%) | +0.731 (+3.0%) |
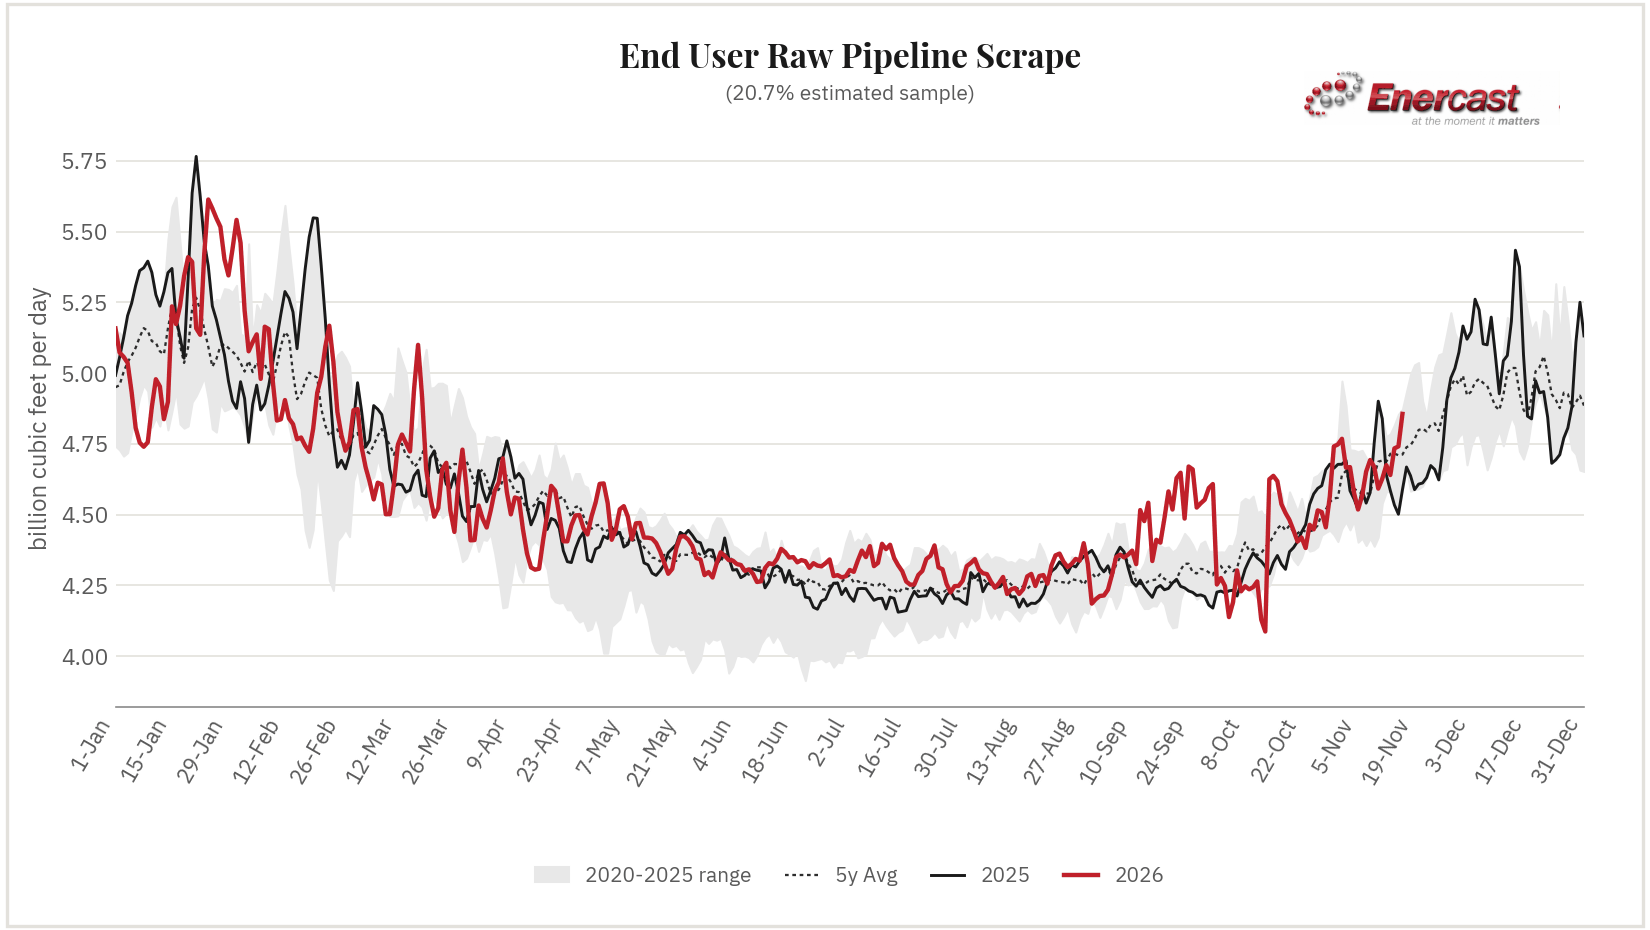
| End User 20.7% Sample | 4.592 | 4.627 | 4.675 | 4.640 | 4.896 | +0.369 (+8.2%) | +0.035 (+0.8%) |
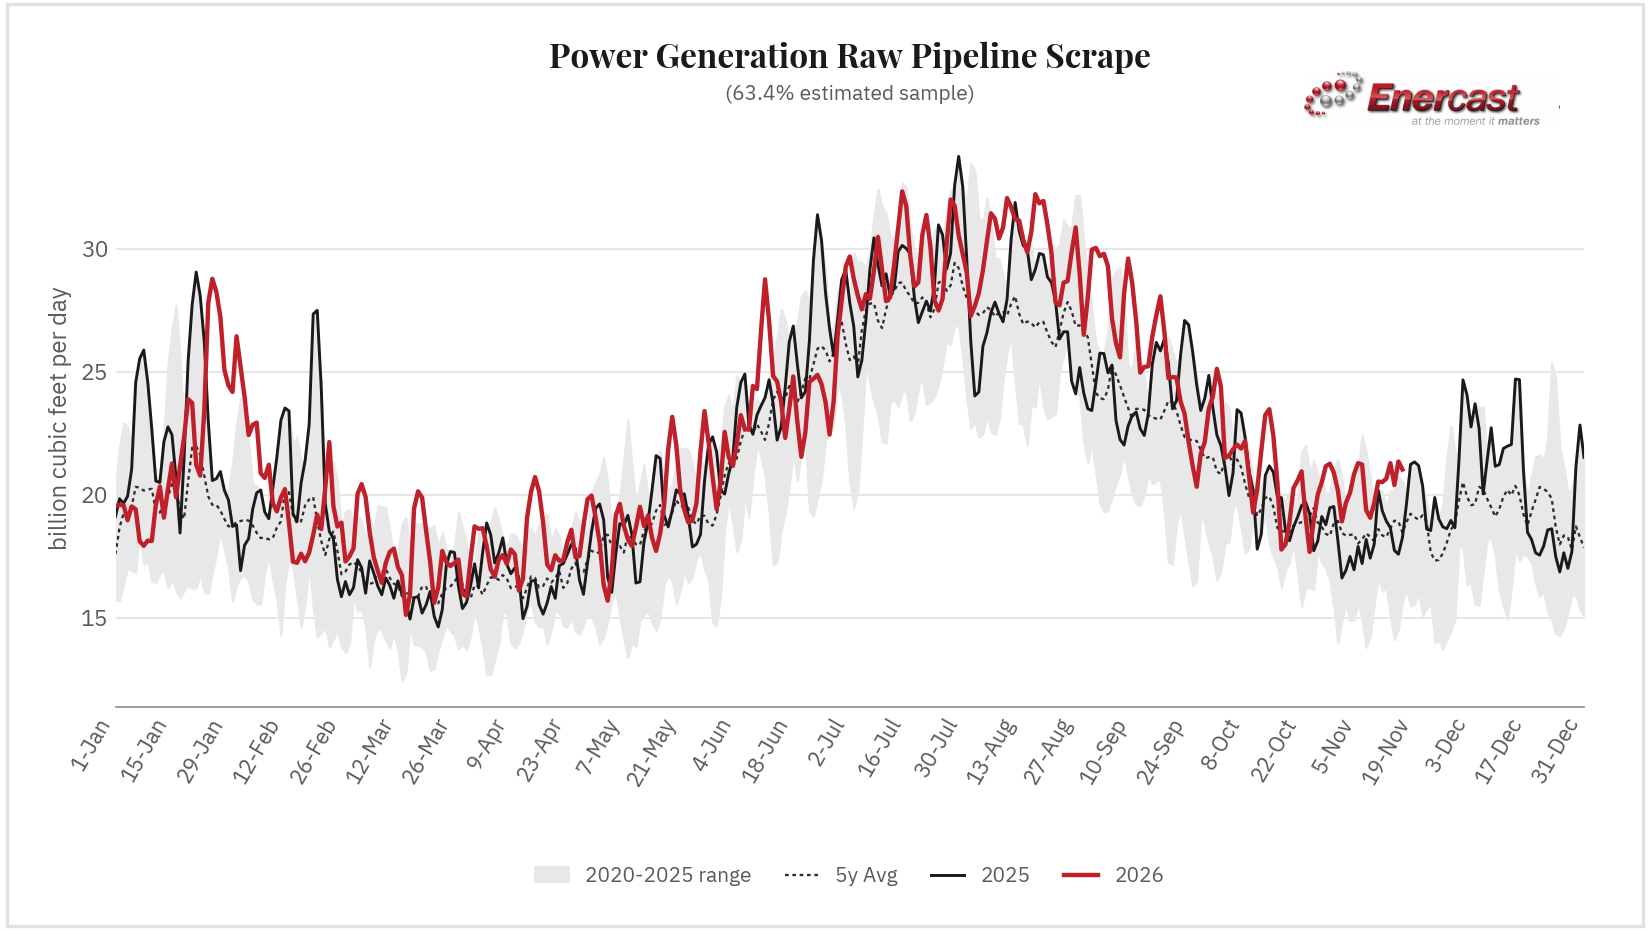
| Power Generation 63.4% Sample | 20.537 | 20.518 | 20.655 | 21.293 | 20.756 | -0.316 (-1.5%) | +0.197 (+1.0%) |
| Storage Sample unknown | +2.178 | +2.636 | +2.295 | +1.102 | +0.816 * | -0.573 (-41.3%) | -0.373 (-14.7%) |
* Storage: Vector Pipeline has not published updated data for today.
Gas day November 14, 2026 is today's gas day — not yet fully settled, and subject to revision as later cycles post.
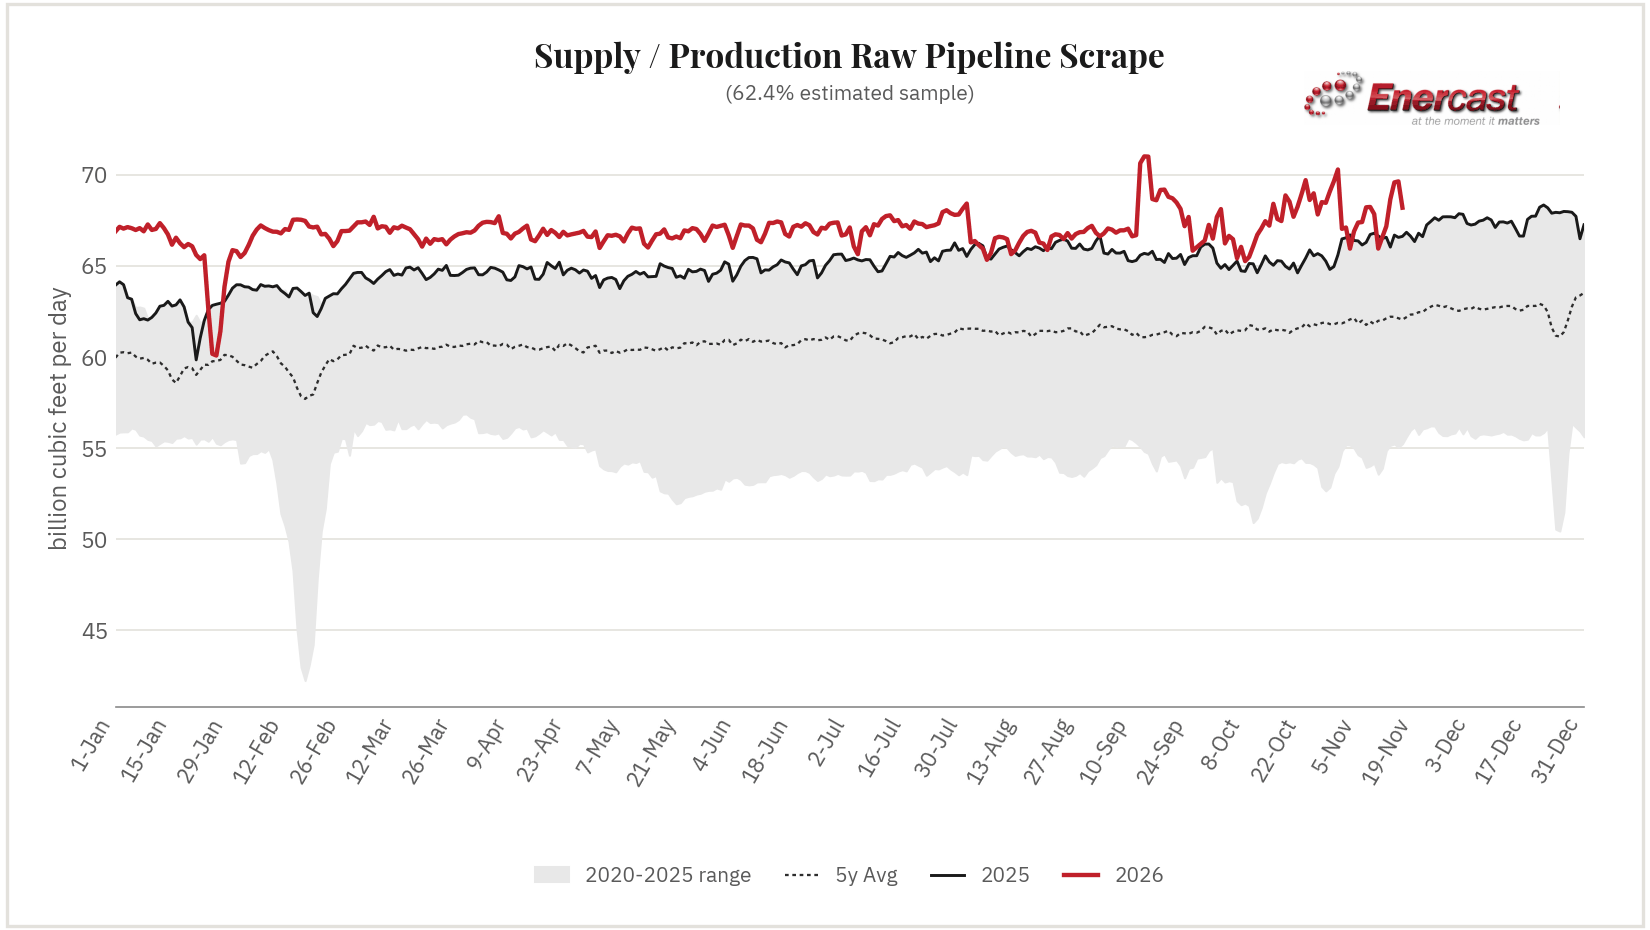
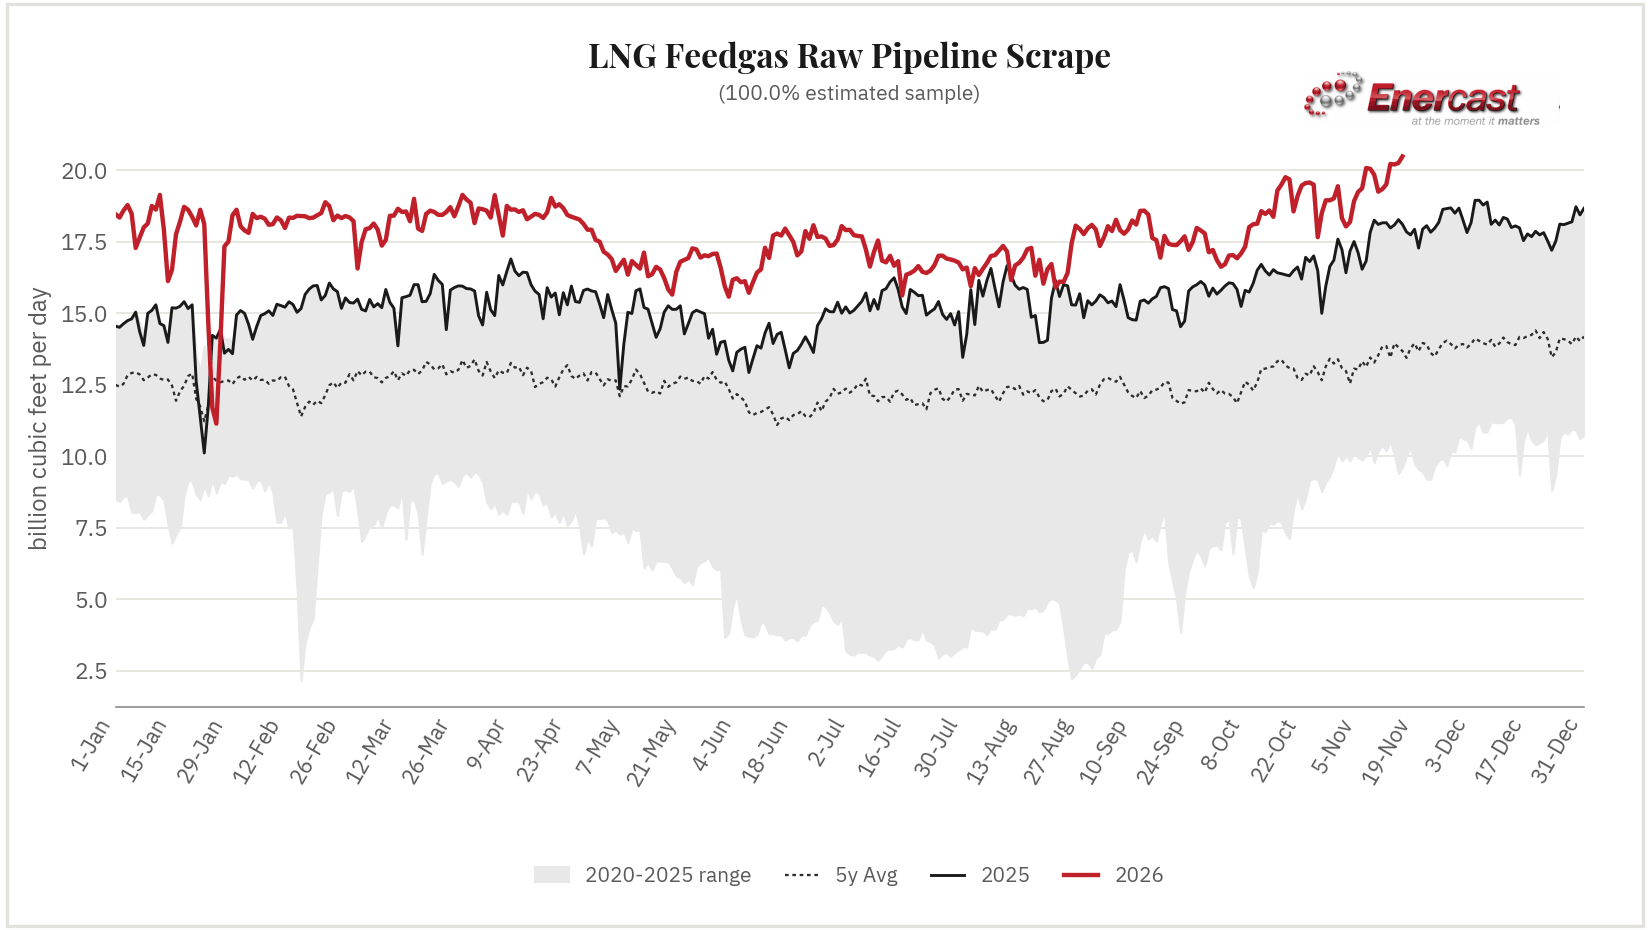
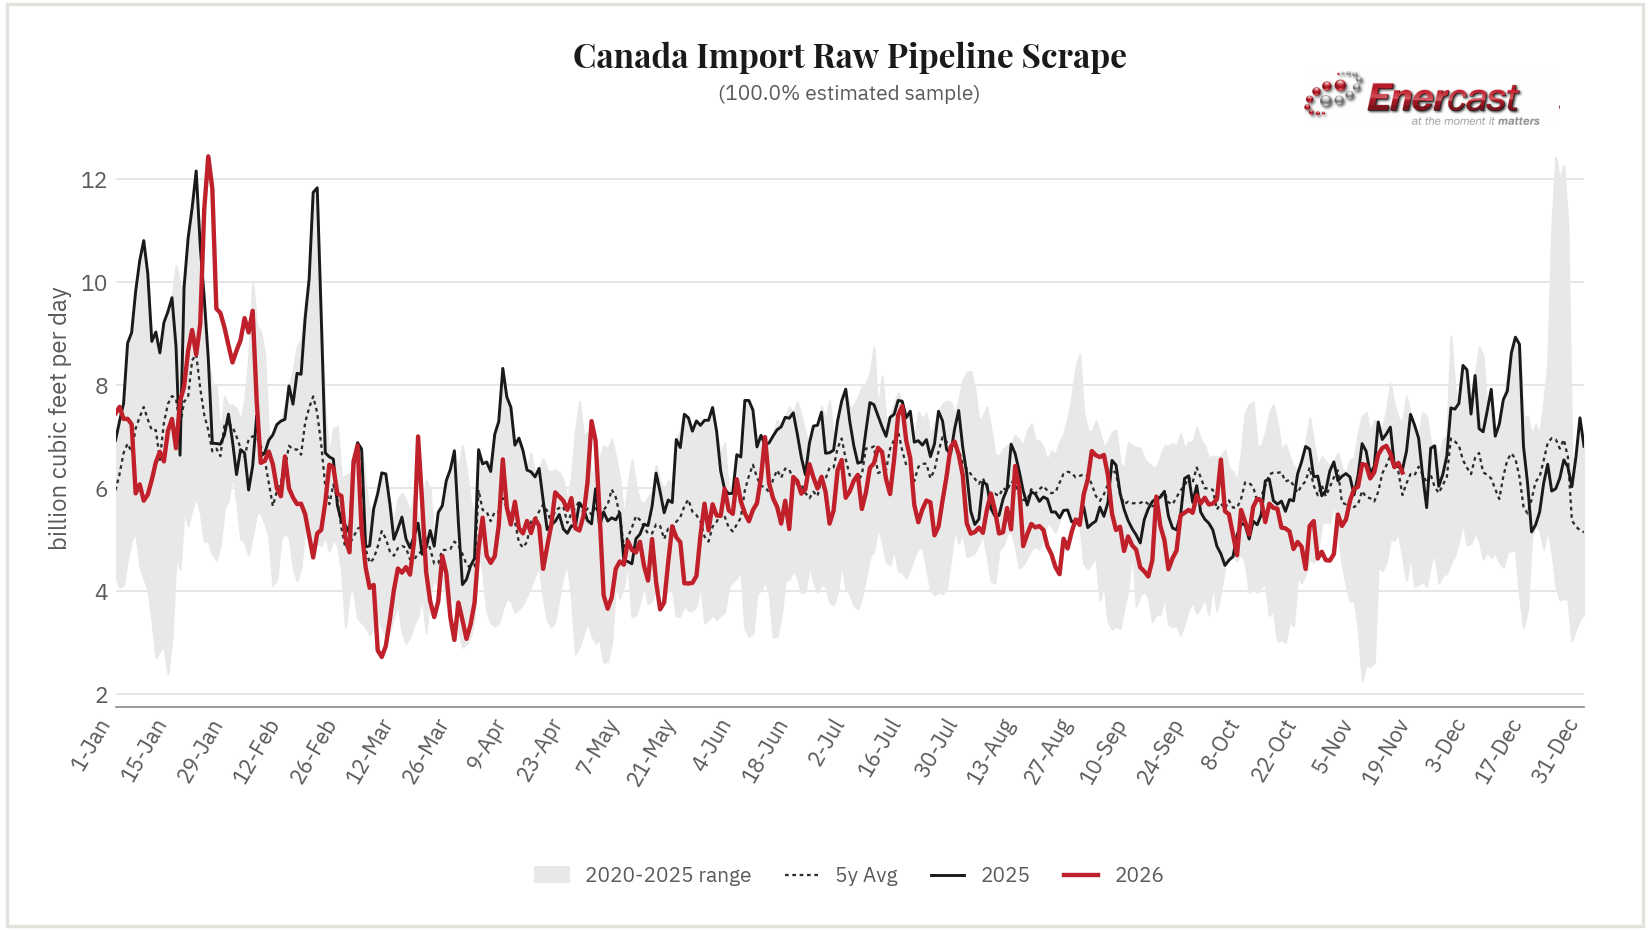
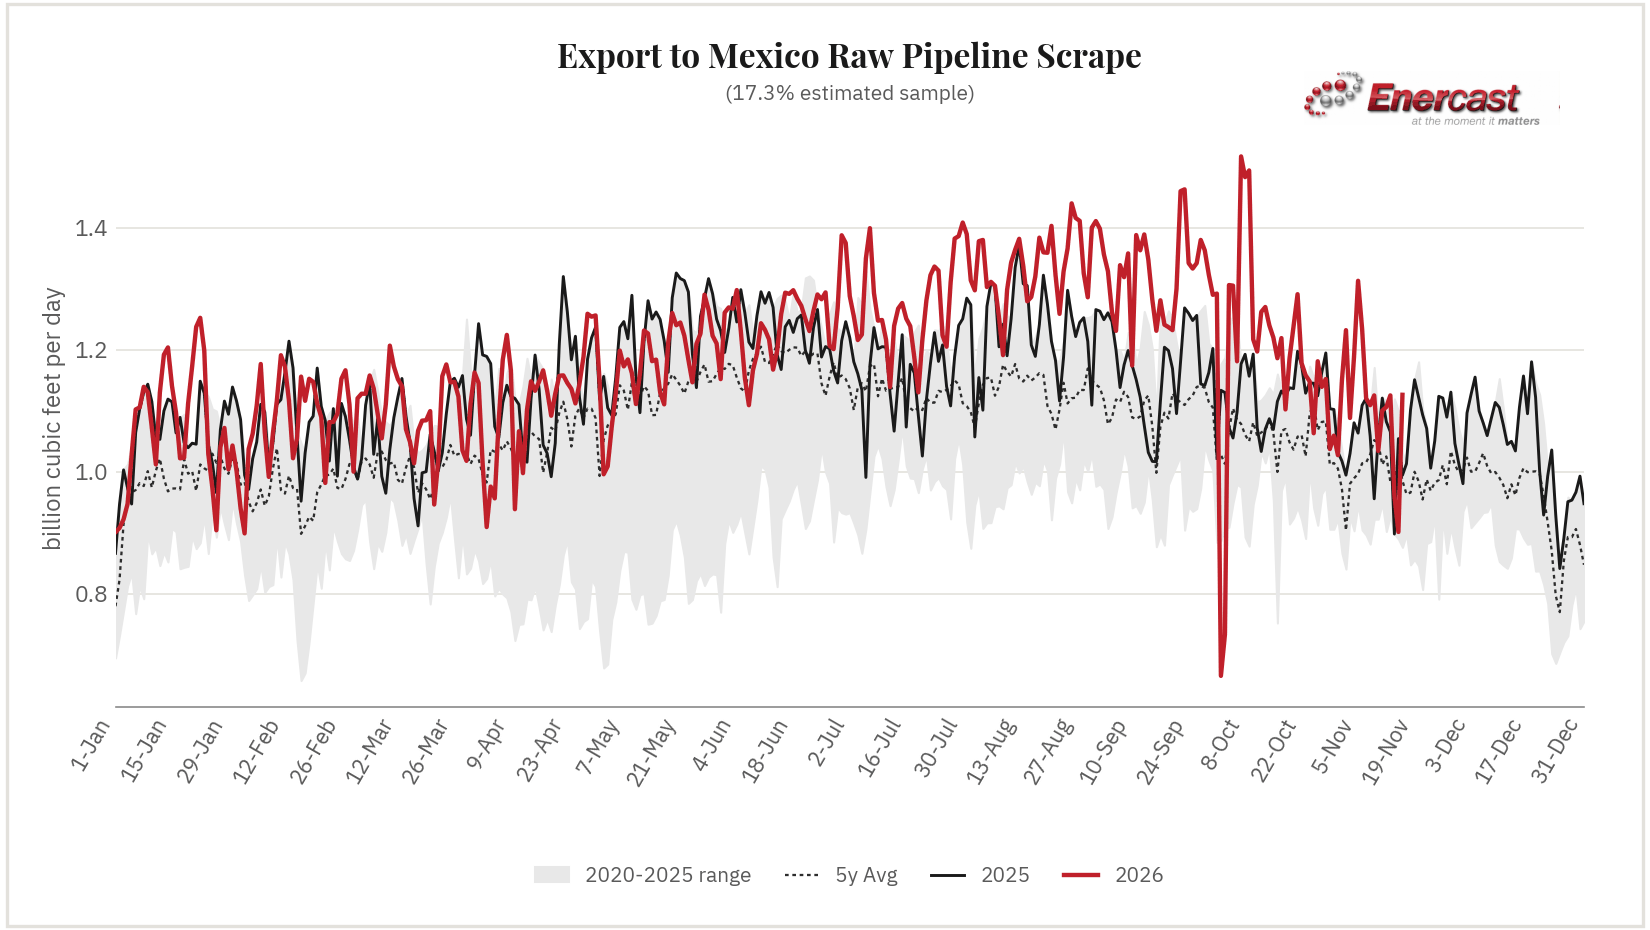
| Meter / Interconnect | Pipeline | Location | Gas Day Bcf/d | Δ DoD | Δ 7d MA |
|---|---|---|---|---|---|
| ZICK M3659 MP 47.22 (receipt, gathering) | Transco | Pennsylvania | 1.101 | -0.005 (-0.5%) | -0.001 (-0.1%) |
| SHERWOOD (receipt, processing) | Rover Pipeline | West Virginia | 0.826 | -0.013 (-1.5%) | -0.002 (-0.2%) |
| APPLACHA/STAGEPS CHERRY RD SULLIVAN (receipt, gathering) | Stagecoach Pipeline and Storage | Pennsylvania | 0.821 | -0.001 (-0.1%) | -0.000 (-0.0%) |
| TOMBS RUN M3610 MP 174.05 (receipt, gathering) | Transco | Pennsylvania | 0.812 | +0.004 (+0.5%) | +0.012 (+1.6%) |
| Sherwood - MXP (receipt, processing) | Columbia Gas Transmission (TCO) | West Virginia | 0.746 | -0.057 (-7.1%) | -0.008 (-1.0%) |
| APPLACHA/TGP UDP LIBERTY DEHY: RIP (receipt, gathering) | Tennessee Gas Pipeline (TGP) | Pennsylvania | 0.731 | -0.107 (-12.8%) | -0.012 (-1.5%) |
| BROADMORE RD. (receipt, intrastate_interconnect) | Columbia Gulf Transmission (CGT) | Louisiana | 0.730 | +0.009 (+1.2%) | +0.004 (+0.6%) |
| LEG-TRANSCO M3683 MP 469.25 (receipt, gathering) | Transco | Louisiana | 0.719 | -0.017 (-2.3%) | -0.005 (-0.7%) |
View full detail → 1715 tracked locations for gas day
| Meter / Interconnect | Pipeline | Location | Gas Day Bcf/d | Δ DoD | Δ 7d MA |
|---|---|---|---|---|---|
| Plaquemines -- Gator Express terminal delivery | Venture Global Gator Express | Gulf Coast | 4.281 | -0.059 (-1.4%) | -0.010 (-0.2%) |
| Corpus Christi (Cheniere) | Corpus Christi LNG | Gulf Coast | 2.686 | -0.006 (-0.2%) | -0.001 (-0.0%) |
| Calcasieu Pass -- TransCameron terminal delivery | TransCameron Pipeline | Gulf Coast | 1.807 | -0.007 (-0.4%) | +0.003 (+0.2%) |
| Sabine Pass -- Creole Trail leg | Sabine Pass LNG | Gulf Coast | 1.556 | +0.038 (+2.5%) | +0.006 (+0.4%) |
| Cameron -- CIP terminal delivery | Cameron Interstate Pipeline | Gulf Coast | 1.548 | -0.000 (-0.0%) | -0.000 (-0.0%) |
| Sabine -- KMLP terminal delivery | Kinder Morgan Louisiana Pipeline | Gulf Coast | 1.540 | +0.009 (+0.6%) | +0.014 (+1.2%) |
| Freeport -- Gulf South Stratton Ridge leg | Gulf South Pipeline | Gulf Coast | 1.449 | -0.037 (-2.5%) | -0.003 (-0.2%) |
| Sabine Pass -- Transco Lighthouse Road delivery | Transco | Gulf Coast | 1.159 | -0.040 (-3.3%) | -0.004 (-0.3%) |
View full detail → 15 tracked locations for gas day
| Meter / Interconnect | Pipeline | Location | Gas Day Bcf/d | Δ DoD | Δ 7d MA |
|---|---|---|---|---|---|
| GTN Kingsgate | Gas Transmission Northwest | Pacific Northwest | 2.860 | -0.003 (-0.1%) | -0.000 (-0.0%) |
| Alliance Border USA -- import from Canada (Sherwood, ND) | Alliance Pipeline | Midwest | 1.916 | -0.014 (-0.7%) | +0.004 (+0.2%) |
| Great Lakes Emerson (receipt) | Great Lakes Gas Transmission | Upper Midwest | 1.775 | +0.028 (+1.6%) | +0.014 (+0.8%) |
| Northwest Sumas (receipt) | Northwest Pipeline | Pacific Northwest | 1.400 | +0.029 (+2.1%) | +0.044 (+3.5%) |
| Vector St. Clair (US) -- export to Dawn, Ontario | Vector Pipeline | Midwest | -0.936 | -0.072 (-8.3%) | -0.060 (-10.8%) |
| Great Lakes St Clair (delivery to Ontario) | Great Lakes Gas Transmission | Upper Midwest | -0.798 | -0.015 (-1.9%) | -0.023 (-3.3%) |
| Iroquois Waddington (receipt) | Iroquois Gas Transmission | Northeast | 0.603 | -0.183 (-23.3%) | +0.058 (+19.6%) |
| TGP Niagara (TRANSCAN UDP, delivery to TransCanada) | Tennessee Gas Pipeline (TGP) | Northeast | -0.570 | +0.010 (+1.7%) | -0.004 (-0.7%) |
View full detail → 16 tracked locations for gas day
| Meter / Interconnect | Pipeline | Location | Gas Day Bcf/d | Δ DoD | Δ 7d MA |
|---|---|---|---|---|---|
| North Baja -- Ogilby (border crossing to Baja California) | North Baja Pipeline | Southwest | 0.388 | -0.032 (-7.6%) | -0.013 (-2.9%) |
| TGP -- Rio Bravo (Hidalgo Co. crossing) | Tennessee Gas Pipeline (TGP) | South Texas | 0.258 | +0.007 (+2.8%) | +0.002 (+0.8%) |
| GASDEAGU/SIERRITA SASABE PIMA (delivery, mexico_border) | Sierrita Gas Pipeline (SGP) | Arizona | 0.097 | -0.000 (-0.0%) | +0.008 (+15.9%) |
| EPNG -- Mexicana de Cobre (Douglas AZ) | El Paso Natural Gas (EPNG) | Southwest | 0.081 | +0.007 (+9.5%) | +0.001 (+1.4%) |
| TGP -- CENAGAS/PEMEX south delivery | Tennessee Gas Pipeline (TGP) | South Texas | 0.076 | -0.134 (-63.8%) | -0.016 (-7.8%) |
| EPNG -- El Fresnal (CFE) | El Paso Natural Gas (EPNG) | Southwest | 0.039 | -0.000 (-0.0%) | -0.003 (-7.4%) |
| EPNG -- Willmex (CENAGAS, Cochise) | El Paso Natural Gas (EPNG) | Southwest | 0.035 | +0.000 (+0.0%) | +0.000 (+0.0%) |
| TGP -- Valley Crossing allocation | Tennessee Gas Pipeline (TGP) | South Texas | 0.000 | +0.000 | +0.000 |
View full detail → 8 tracked locations for gas day
| Meter / Interconnect | Pipeline | Location | Gas Day Bcf/d | Δ DoD | Δ 7d MA |
|---|---|---|---|---|---|
| WISCONSIN | ANR Pipeline (TC Energy) | WOOD, Wisconsin | 1.095 | -0.153 (-12.3%) | +0.036 (+3.7%) |
| NEW YORK FAC GROUP MP 1829.08 | Transco | Richmond, New York | 0.977 | -0.076 (-7.2%) | +0.042 (+5.1%) |
| NIPSCO/NGPL CDP | Natural Gas Pipeline (NGPL) | COOK, Illinois | 0.662 | -0.047 (-6.6%) | +0.013 (+2.2%) |
| PUBLIC SERVICE E&G MP 1809.25 | Transco | Essex, New Jersey | 0.583 | -0.080 (-12.1%) | +0.021 (+4.2%) |
| NICORGAS/NGPL CDP | Natural Gas Pipeline (NGPL) | WILL, Illinois | 0.581 | -0.100 (-14.7%) | -0.082 (-8.7%) |
| PGLC/NGPL CDP | Natural Gas Pipeline (NGPL) | COOK, Illinois | 0.575 | -0.020 (-3.4%) | +0.027 (+6.0%) |
| SOCETS/MPC (SOCWR) WHEELER RIDGE | Mojave Pipeline (MOPC) | 0.479 | +0.018 (+3.9%) | +0.017 (+3.8%) | |
| PUBLIC SERV N C MP 1323.51 | Transco | Gaston, North Carolina | 0.470 | -0.008 (-1.7%) | +0.002 (+0.4%) |
View full detail → 4059 tracked locations for gas day
| Meter / Interconnect | Pipeline | Location | Gas Day Bcf/d | Δ DoD | Δ 7d MA |
|---|---|---|---|---|---|
| MZX Deduct | Texas Gas Transmission | DE SOTO, Mississippi | 0.292 | +0.000 (+0.0%) | +0.002 (+0.7%) |
| Methanex Geismer 2 | Gulf South Pipeline | 0.206 | +0.016 (+8.4%) | +0.003 (+1.6%) | |
| GASTON / CENT AL - MULBERRY MP 902.41 | Transco | CHILTON, Alabama | 0.158 | +0.010 (+6.7%) | +0.002 (+1.5%) |
| Port Arthur-Motiva | Florida Gas Transmission | JEFFERSON, Texas | 0.114 | +0.019 (+19.9%) | +0.003 (+3.3%) |
| FHR PINE BEND ROSEMOUNT MN COMPLEX | Northern Natural Gas | DAKOTA, Minnesota | 0.105 | -0.007 (-6.2%) | +0.001 (+1.0%) |
| CW-KINGSPORT EXPANSION EASTMAN #2, SULLIVAN, TN | East Tennessee Natural Gas | SULLIVAN, Tennessee | 0.094 | +0.017 (+22.1%) | +0.004 (+5.2%) |
| TOSCO REFINERY M6304 MP 20.7 | Transco | DELAWARE, Pennsylvania | 0.093 | +0.062 (+206.0%) | +0.008 (+24.5%) |
| WRB REFINING LP | Enable Mississippi River Transmission (MRT) | MADISON, Illinois | 0.091 | -0.001 (-1.1%) | +0.000 (+0.0%) |
View full detail → 1347 tracked locations for gas day
| Meter / Interconnect | Pipeline | Location | Gas Day Bcf/d | Δ DoD | Δ 7d MA |
|---|---|---|---|---|---|
| SO CO/SNG PLANT MCDONOUGH COBB (Georgia Power Co) | Southern Natural Gas | Fulton County (WRI geocode; meter says Cobb -- see note), GA | 0.325 | +0.013 (+4.2%) | +0.005 (+1.7%) |
| West County MP 34.1 | Gulfstream Natural Gas System | 0.311 | -0.082 (-20.9%) | -0.014 (-3.5%) | |
| BBT BAMA/TGP BAMAGAS COLBERT | Tennessee Gas Pipeline (TGP) | 0.283 | +0.014 (+5.2%) | +0.006 (+2.3%) | |
| Parkway Generation - Sewaren, NJ | Texas Eastern Transmission (TETCO) | 0.275 | +0.232 (+538.3%) | +0.031 (+52.0%) | |
| Lawrenceburg Power Plant | Texas Gas Transmission | 0.270 | -0.009 (-3.2%) | +0.006 (+2.3%) | |
| SRP/EPNG (DSRP PHX) MARICOPA | El Paso Natural Gas (EPNG) | 0.266 | +0.015 (+6.0%) | -0.002 (-0.8%) | |
| Athens | Iroquois Gas Transmission | 0.250 | +0.007 (+2.9%) | +0.020 (+10.8%) | |
| Duke Energy - Citrus County Plant, Citrus Co., FL | Sabal Trail Transmission | 0.239 | +0.034 (+16.6%) | +0.015 (+10.4%) |
View full detail → 565 tracked locations for gas day
| Meter / Interconnect | Pipeline | Location | Gas Day Bcf/d | Δ DoD | Δ 7d MA |
|---|---|---|---|---|---|
| CVP STORAGE POINT (withdrawal, CPL) | CPL | Northeast | +0.875 | +0.000 (+0.0%) | +0.000 (+0.0%) |
| Enstor Katy Storage (withdrawal, Gulf South Pipeline) | Gulf South Pipeline | Gulf Coast | +0.428 | +0.023 (+5.7%) | +0.001 (+0.2%) |
| Egan <-> Texas Eastern storage account (withdrawal, Egan Hub Storage) | Egan Hub Storage | Gulf Coast | +0.400 | -0.143 (-91.3%) | -0.008 (-4.1%) |
| South Chester (withdrawal, Great Lakes Gas Transmission) | Great Lakes Gas Transmission | Midwest | +0.400 | +0.182 (+83.6%) | +0.057 (+183.4%) |
| BayGas <-> Transco interconnect (injection, BayGas Storage) | BayGas Storage | Gulf Coast | -0.341 | +0.051 (+13.0%) | -0.001 (-0.3%) |
| Tx_Gas_SL (net injection/withdrawal, storage) | Pine Prairie Energy Center | Louisiana | -0.322 | -0.009 (-2.9%) | +0.005 (+1.3%) |
| Egan <-> Texas Eastern storage account (injection, Egan Hub Storage) | Egan Hub Storage | Gulf Coast | -0.299 | -0.143 (-91.3%) | -0.008 (-4.1%) |
| Monroe Gas Storage (TGP interconnect) (withdrawal, Tennessee Gas Pipeline (TGP)) | Tennessee Gas Pipeline (TGP) | Northeast | +0.279 | -0.131 (-32.0%) | -0.007 (-1.9%) |
View full detail → 272 tracked locations for gas day
Get this data
- CSV / RSS feed — coming soon
- Embed / badge snippet & license terms — coming soon
- Pro real-time access →
Recent days
Free for non-commercial reuse with attribution and a live, followed link to this page; commercial use and automated collection need permission (see the Terms of Use). Figures are PipeScrape's own scraped totals from monitored interstate pipelines; comparison percentages are against the national supply/demand benchmark where available. Gas day November 14, 2026 reflects same-day (T0) data as of publish time 2026-11-14 05:15 local; figures may be revised as later nomination cycles post. Day-over-day compares each gas day at the same point in its posting cycle, so it is not the difference between the two dated columns — earlier days have since settled upward as later cycles posted.