
Posted Quantities, Not Estimates
Every figure on these pages is a posted scheduled quantity — the volume a pipeline published at a named meter, on a named cycle, added up. Not measured flow, not a model: what the pipeline posted. Nothing is scaled to a national total (LNG Canada, a labeled exception, is derived).
For a trader the question is rarely “what is U.S. power burn today?” It is “what changed since yesterday, where, and is it real?” Postings answer all three better than a scaled-up estimate: the figure is available as each cycle closes, at the point where the gas moved, with the filing to prove it. Our own tests showed that scaling our data up to match a national estimate produced a number no better than the estimate, published later — so we stopped.
We cover the interstate system, not the whole country. Texas intrastate pipelines, customers behind LDC citygates and the California utilities don’t post the same way, so those flows are not in our totals yet. We are adding additional meters and pipelines every week, each validated before it counts, so coverage keeps rising. What we won’t do is invent the rest.
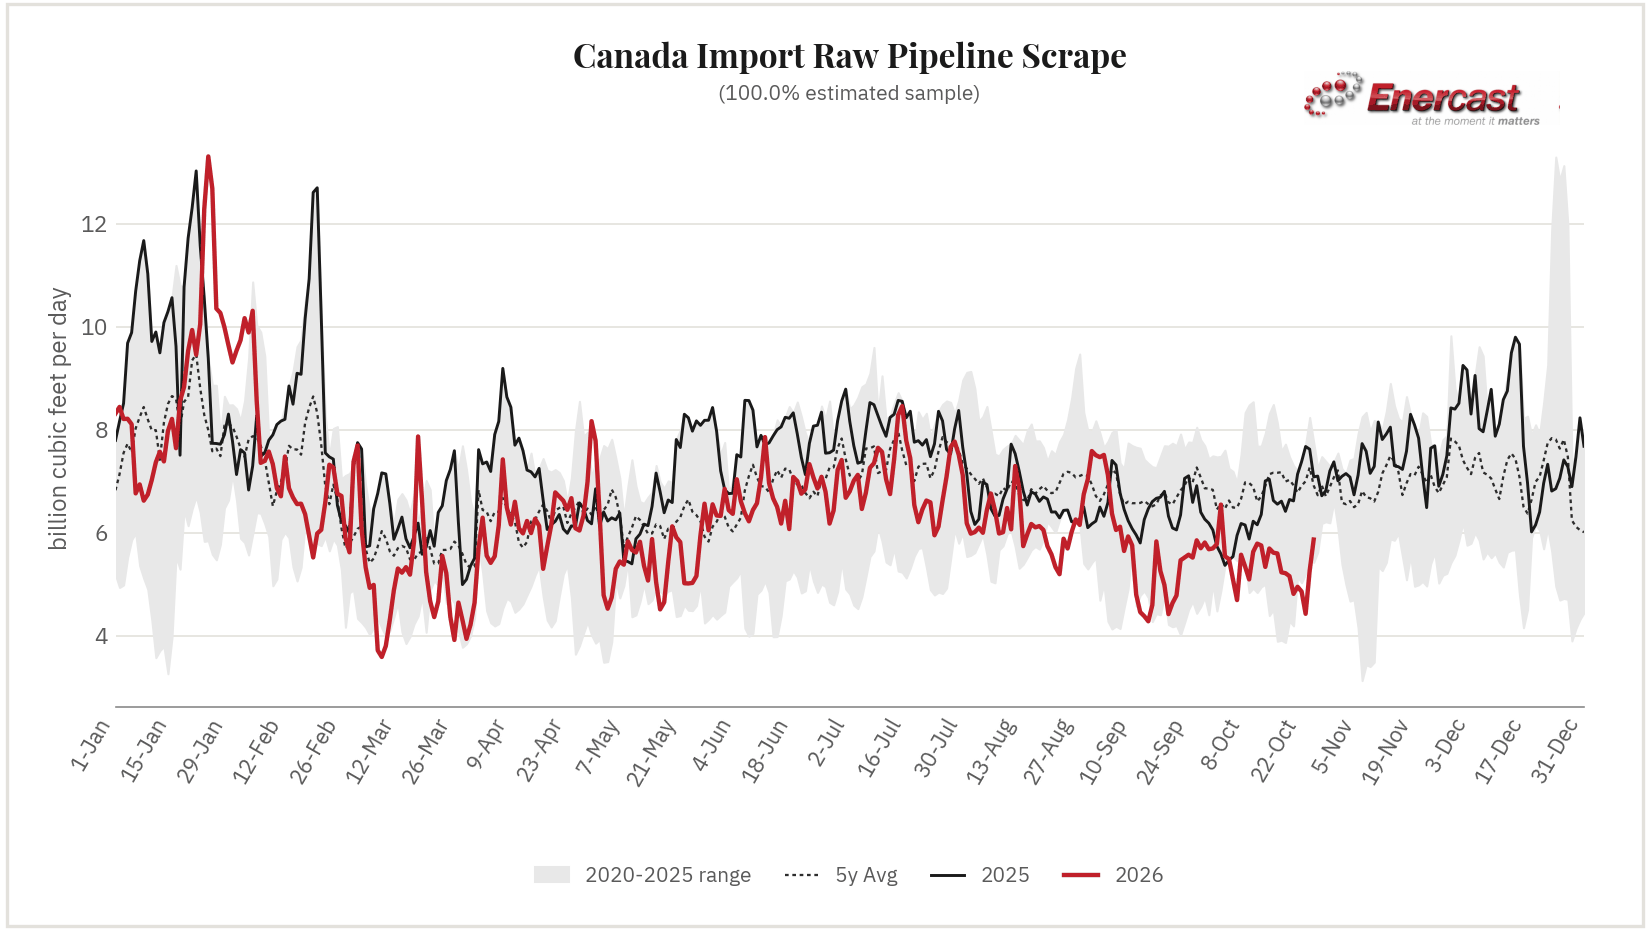
Border-crossing interconnect meters where Canadian supply enters the U.S. interstate system.
| Category | Oct-20 | Oct-21 | Oct-22 | Oct-23 | Oct-24 | Oct-25 | Δ DoDvs. same cycle | Δ 7d MA |
|---|---|---|---|---|---|---|---|---|
| Canada Import | 4.815 | 4.953 | 4.861 | 4.428 | 5.264 | 5.131 | -0.030 (-0.6%) | -0.012 (-0.2%) |
| ↳Imports from Canada | 7.306 | 7.383 | 7.380 | 7.322 | 8.078 | 7.942 | -0.022 (-0.3%) | +0.062 (+0.8%) |
| ↳Exports to Canada | -2.491 | -2.430 | -2.519 | -2.894 | -2.814 | -2.811 | -0.008 (-0.3%) | -0.074 (-2.9%) |
Updated daily by 7:30 AM ET for free subscribers — Pro subscribers get this update by 2:45 AM ET, plus Intra‑Day change alerts. Sub-category rows are the parts this total is summed from — measured at separate, non-overlapping meters, so they add to the total for any gas day computed in a single run. The figure above is a NET: gross imports from Canada less gross exports to Canada, which is why the export row below is negative and the two sum to it. Each direction is measured at its own border meters — nine import points and seven export points, with Chippawa posting separately in both directions.
| Pipeline | Meter / Interconnect | Location | Gas Day Bcf/d | Δ DoD | Δ 7d MA |
|---|---|---|---|---|---|
| Gas Transmission Northwest | GTN Kingsgate | Pacific Northwest | 2.950 | -0.050 (-1.7%) | +0.043 (+1.7%) |
| Alliance Pipeline | Alliance Border USA -- import from Canada (Sherwood, ND) | Midwest | 1.793 | -0.006 (-0.3%) | +0.005 (+0.3%) |
| Great Lakes Gas Transmission | Great Lakes Emerson (receipt) | Upper Midwest | 1.130 | -0.004 (-0.4%) | -0.001 (-0.1%) |
| Northwest Pipeline | Northwest Sumas (receipt) | Pacific Northwest | 0.858 | -0.007 (-0.8%) | +0.012 (+1.4%) |
| Vector Pipeline | Vector St. Clair (US) -- export to Dawn, Ontario | Midwest | -0.715 | +0.019 (+2.6%) | -0.057 (-10.8%) |
| Great Lakes Gas Transmission | Great Lakes St Clair (delivery to Ontario) | Upper Midwest | -0.607 | +0.001 (+0.2%) | -0.008 (-1.4%) |
| Tennessee Gas Pipeline (TGP) | TGP Niagara (TRANSCAN UDP, delivery to TransCanada) | Northeast | -0.579 | +0.000 (+0.0%) | +0.001 (+0.2%) |
| Viking Gas Transmission | Viking Emerson -- import from Canada (Kittson County, MN; TC Mainline delivery to Viking, alongside Great Lakes Emerson 33975) | Upper Midwest | 0.515 | +0.003 (+0.6%) | +0.001 (+0.2%) |
| NEXUS Gas Transmission (U.S.) | NEXUS St. Clair (US) -- export to Ontario | Midwest | -0.416 | -0.008 (-2.0%) | -0.008 (-2.3%) |
| Great Lakes Gas Transmission | Great Lakes St Clair (receipt from Ontario) | Upper Midwest | 0.402 | -0.069 (-14.6%) | +0.010 (+2.4%) |
| Empire Pipeline | Empire Chippawa (TCPL - Chippawa*, delivery to TransCanada) -- export to Canada | Northeast | -0.243 | +0.000 (+0.0%) | +0.000 (+0.0%) |
| NEXUS Gas Transmission (U.S.) | NEXUS Union St. Clair -- export to Enbridge Gas (Union) | Midwest | -0.150 | +0.000 (+0.0%) | +0.000 (+0.0%) |
| Northern Border Pipeline (NBPL) | NBPL Port of Morgan (receipt) | Midwest | 0.135 | -0.003 (-2.2%) | -0.002 (-1.3%) |
| Iroquois Gas Transmission | Iroquois Waddington (receipt) | Northeast | 0.110 | +0.000 (+0.0%) | -0.006 (-5.1%) |
| Panhandle Eastern Pipe Line | Panhandle Ojibway -- export to Union Gas, Ontario | Midwest | -0.102 | -0.010 (-10.8%) | -0.001 (-1.1%) |
| Empire Pipeline | Empire Chippawa (TCPL - Chippawa*, receipt from TransCanada) -- import from Canada | Northeast | 0.050 | +0.000 (+0.0%) | +0.000 (+0.0%) |
Showing all 16 locations in PipeScrape's registry for this category that posted a real capacity_postings figure for this gas day — the entire tracked universe, not a sample. Each value is that meter's own real, measured scheduled quantity for this gas day (not an estimate or apportionment).