
| Category | Nov-06 | Nov-07 | Nov-08 | Nov-09 | Nov-10 | Δ DoDvs. same cycle | Δ 7d MA |
|---|---|---|---|---|---|---|---|
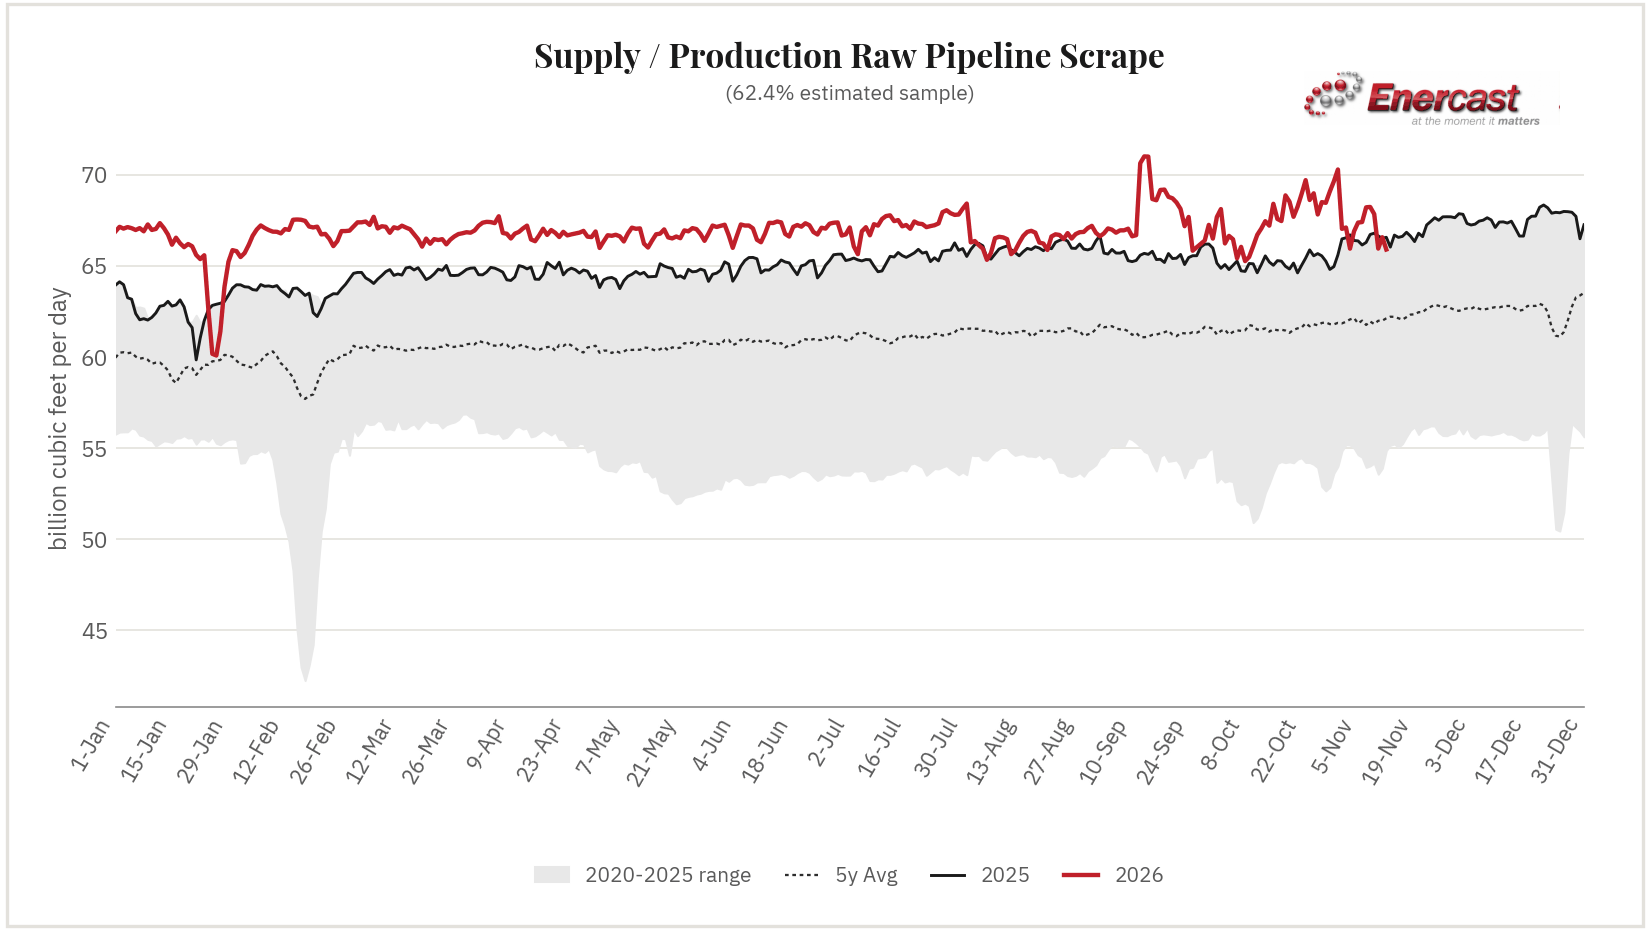
| Supply / Production 62.4% Sample | 67.411 | 68.220 | 68.240 | 67.850 | 64.805 | -2.588 (-3.8%) | -0.164 (-0.2%) |
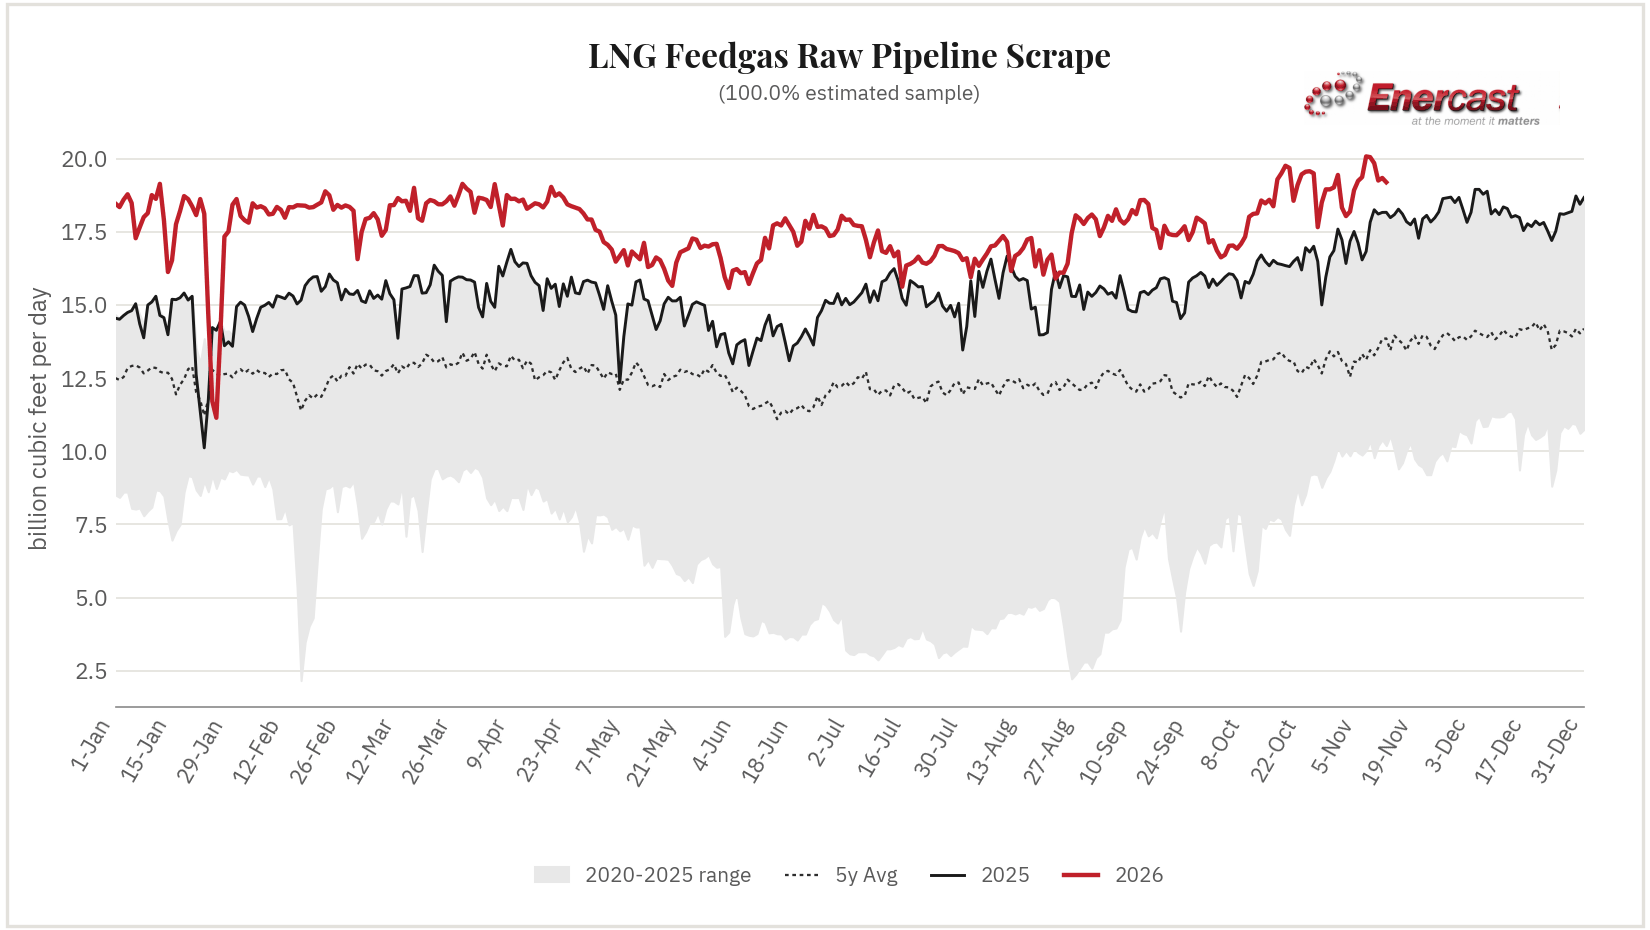
| LNG Feedgas 100.0% Sample | 19.367 | 20.075 | 20.050 | 19.843 | 18.937 | -1.310 (-6.5%) | +0.107 (+0.6%) |
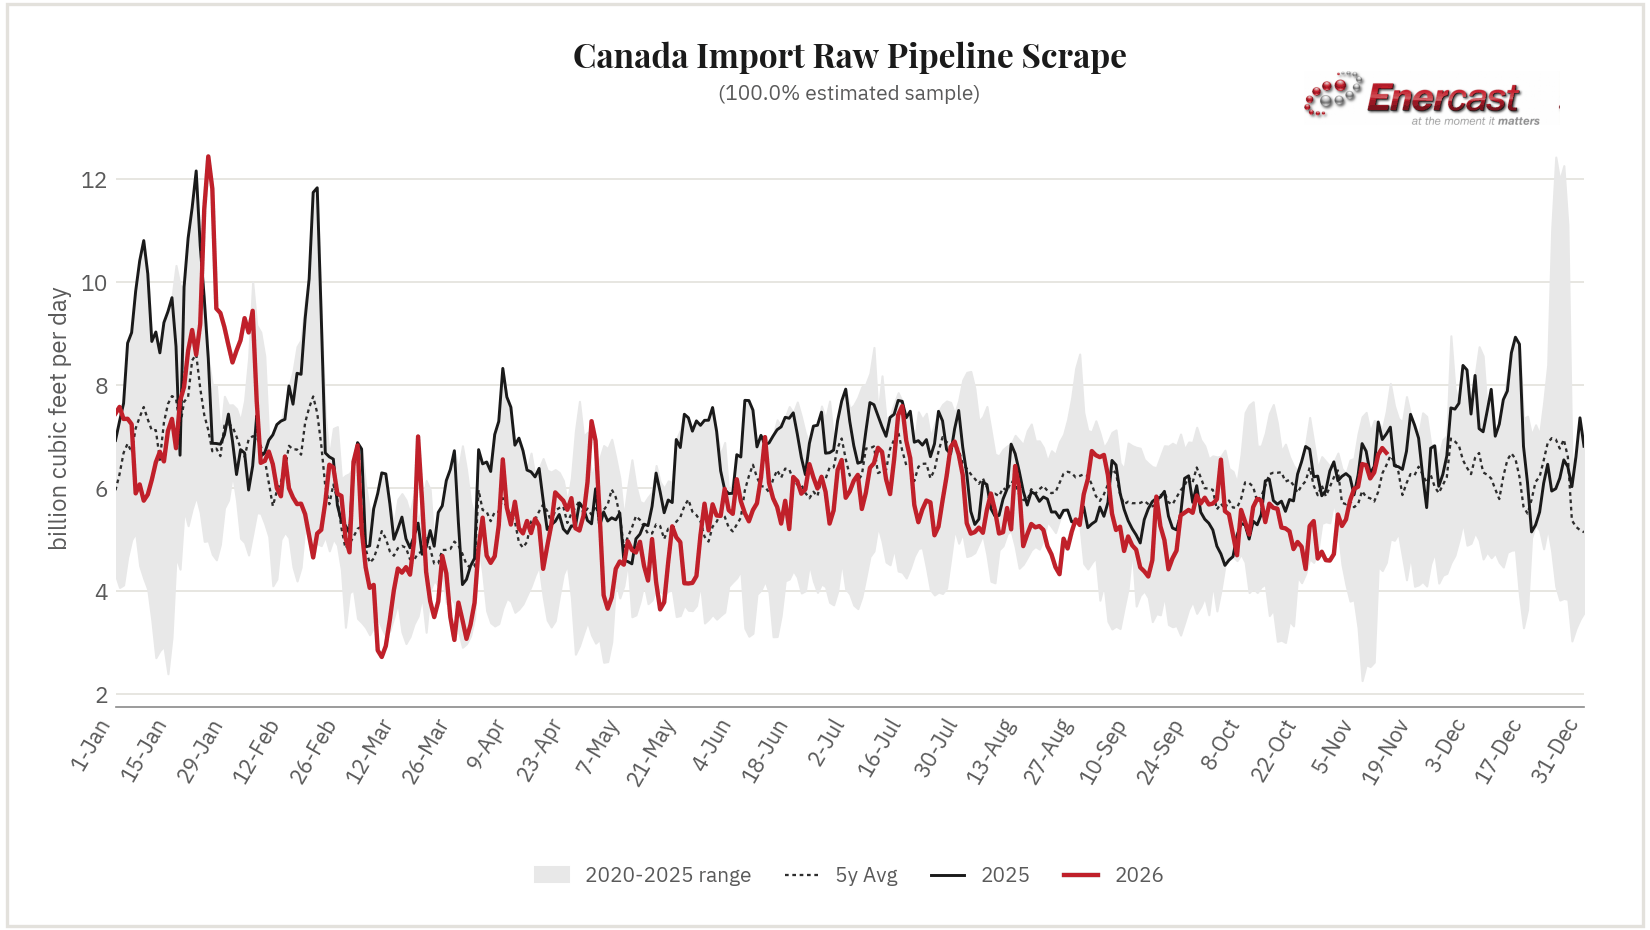
| Canada Import 100.0% Sample | 6.466 | 6.445 | 6.187 | 6.303 | 6.519 | +0.319 (+5.1%) | +0.109 (+1.8%) |
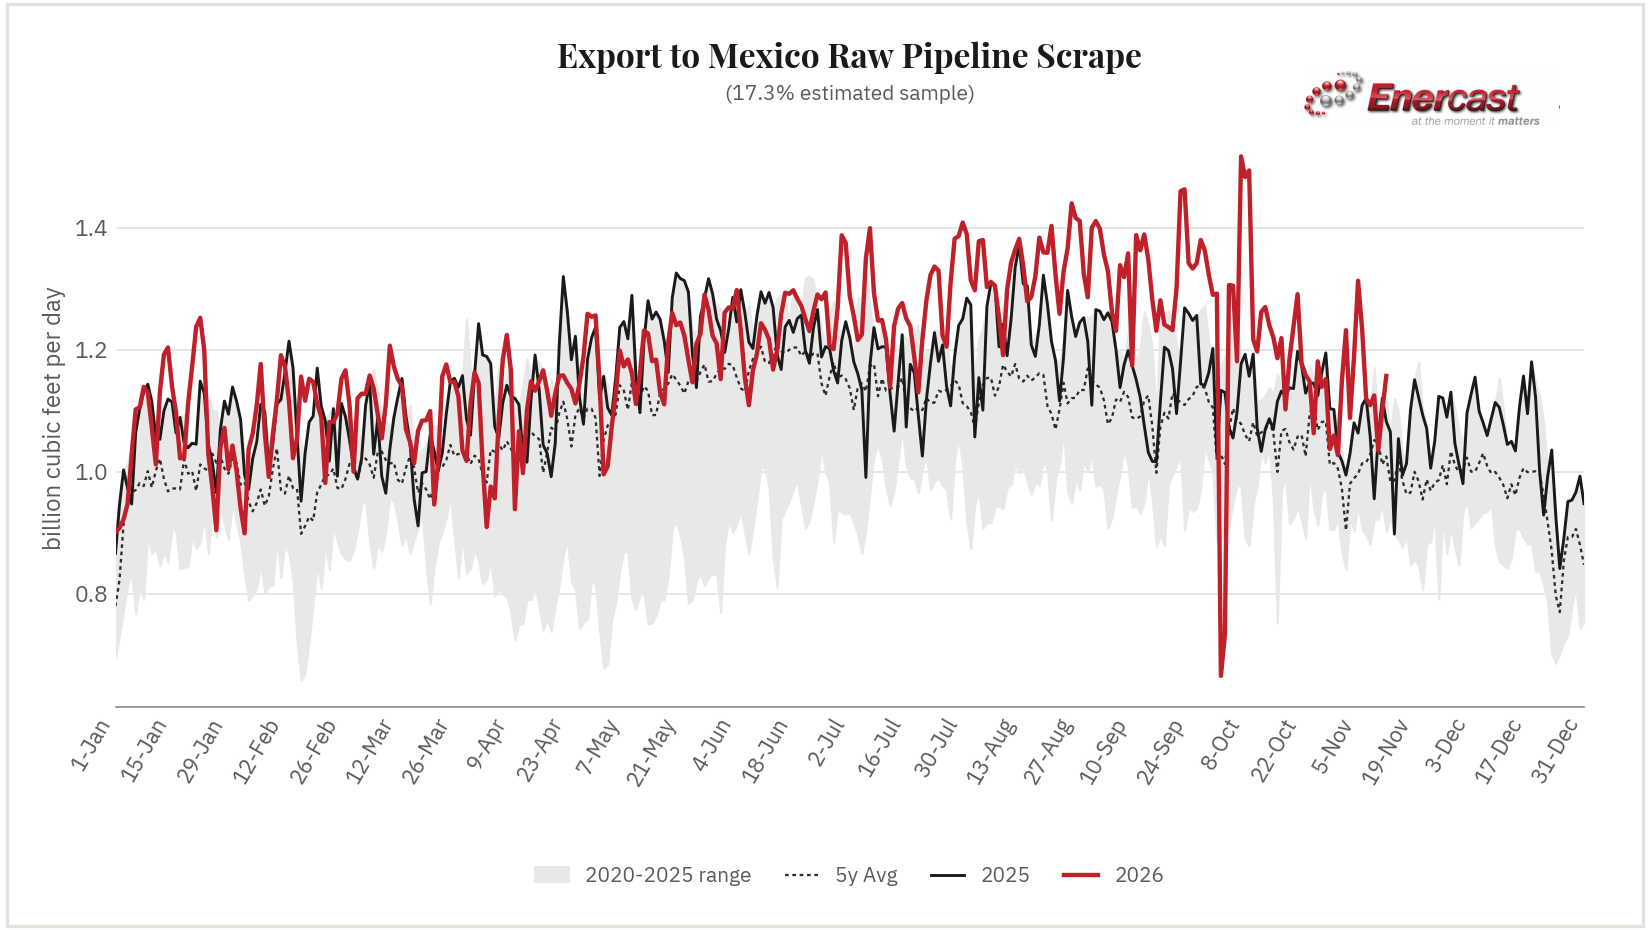
| Export to Mexico 17.3% Sample | 1.234 | 1.120 | 1.109 | 1.125 | 1.085 | -0.111 (-9.3%) | -0.000 (-0.0%) |
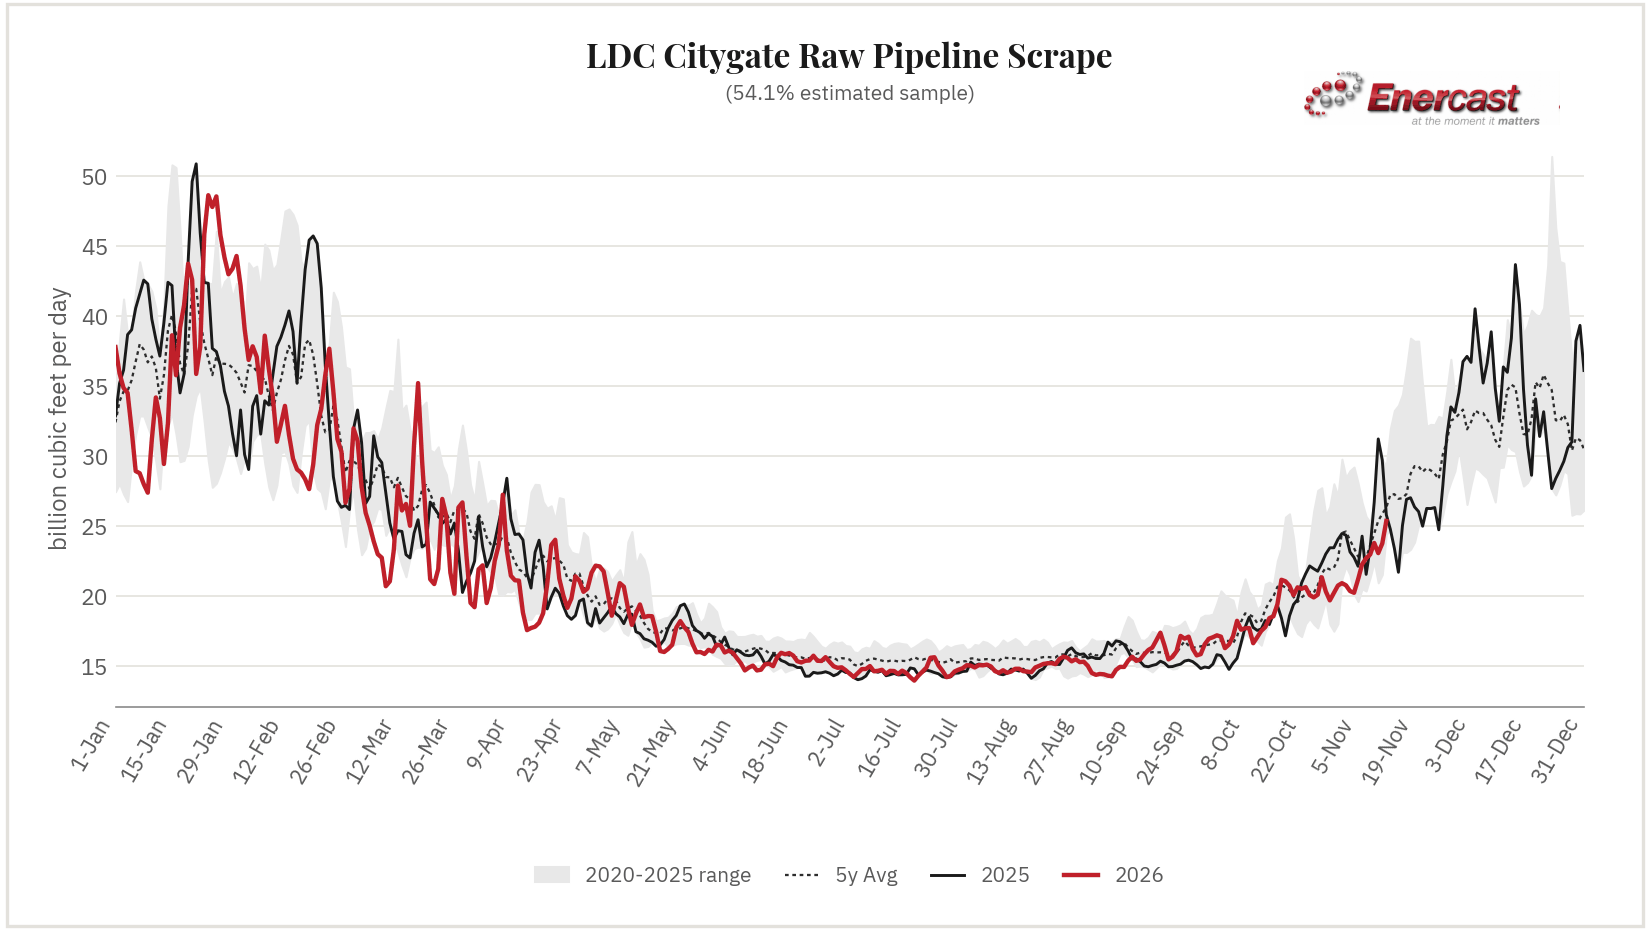
| LDC Citygate 54.1% Sample | 22.269 | 22.710 | 22.971 | 23.780 | 23.184 | -0.501 (-2.1%) | +0.404 (+1.8%) |
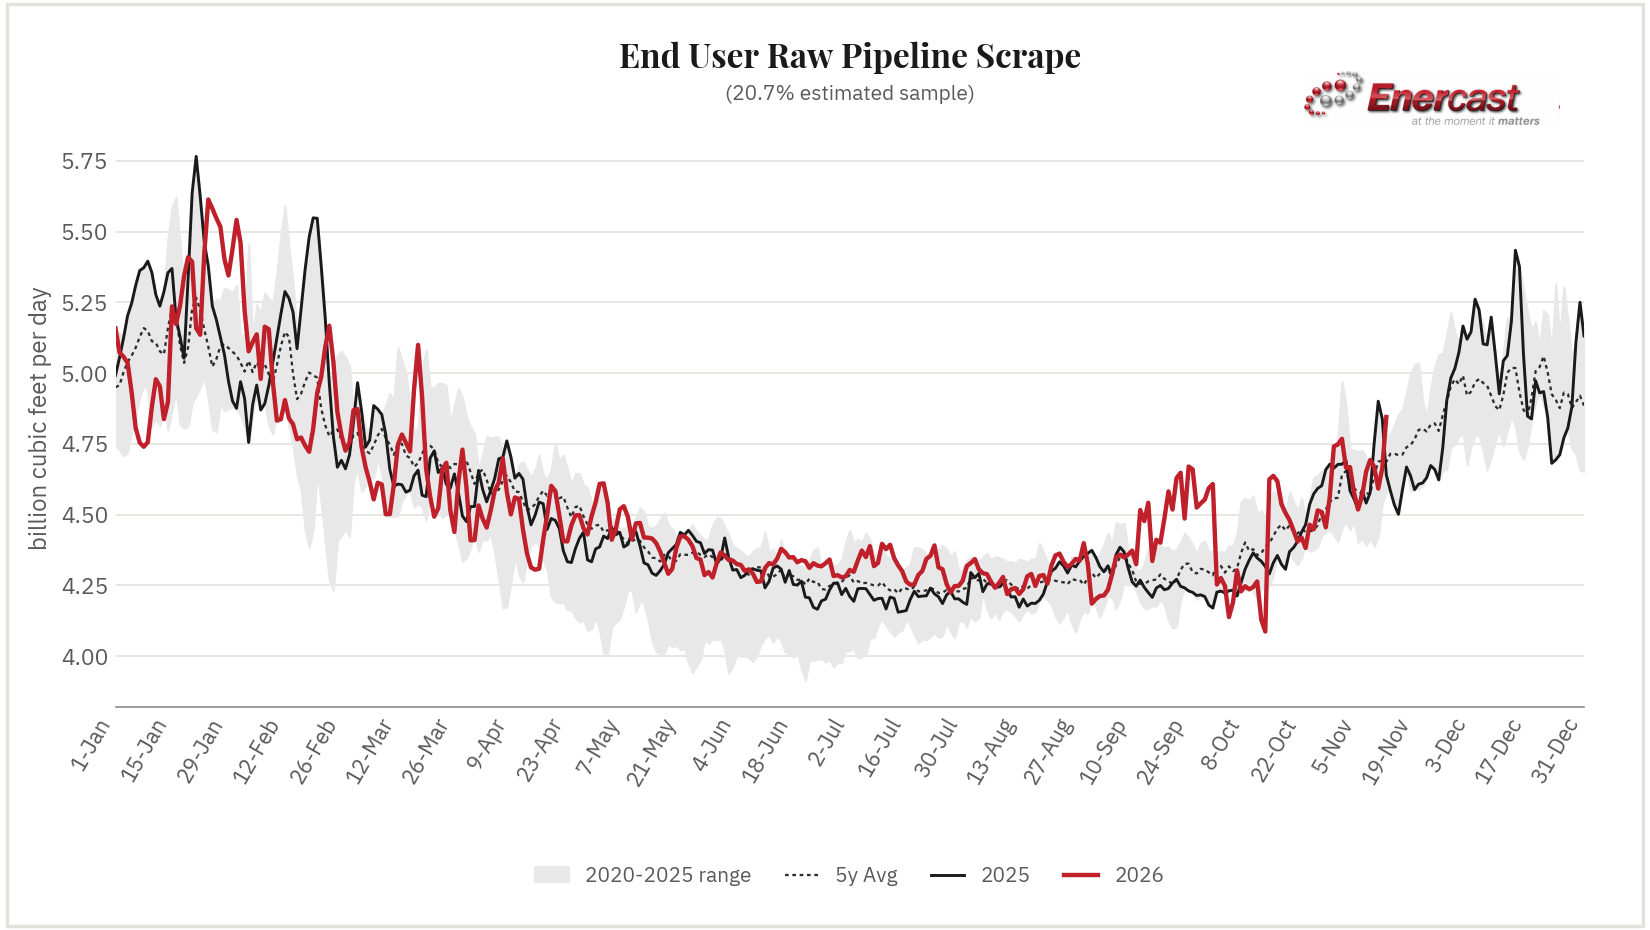
| End User 20.7% Sample | 4.566 | 4.652 | 4.693 | 4.740 | 4.675 | -0.027 (-0.6%) | +0.001 (+0.0%) |
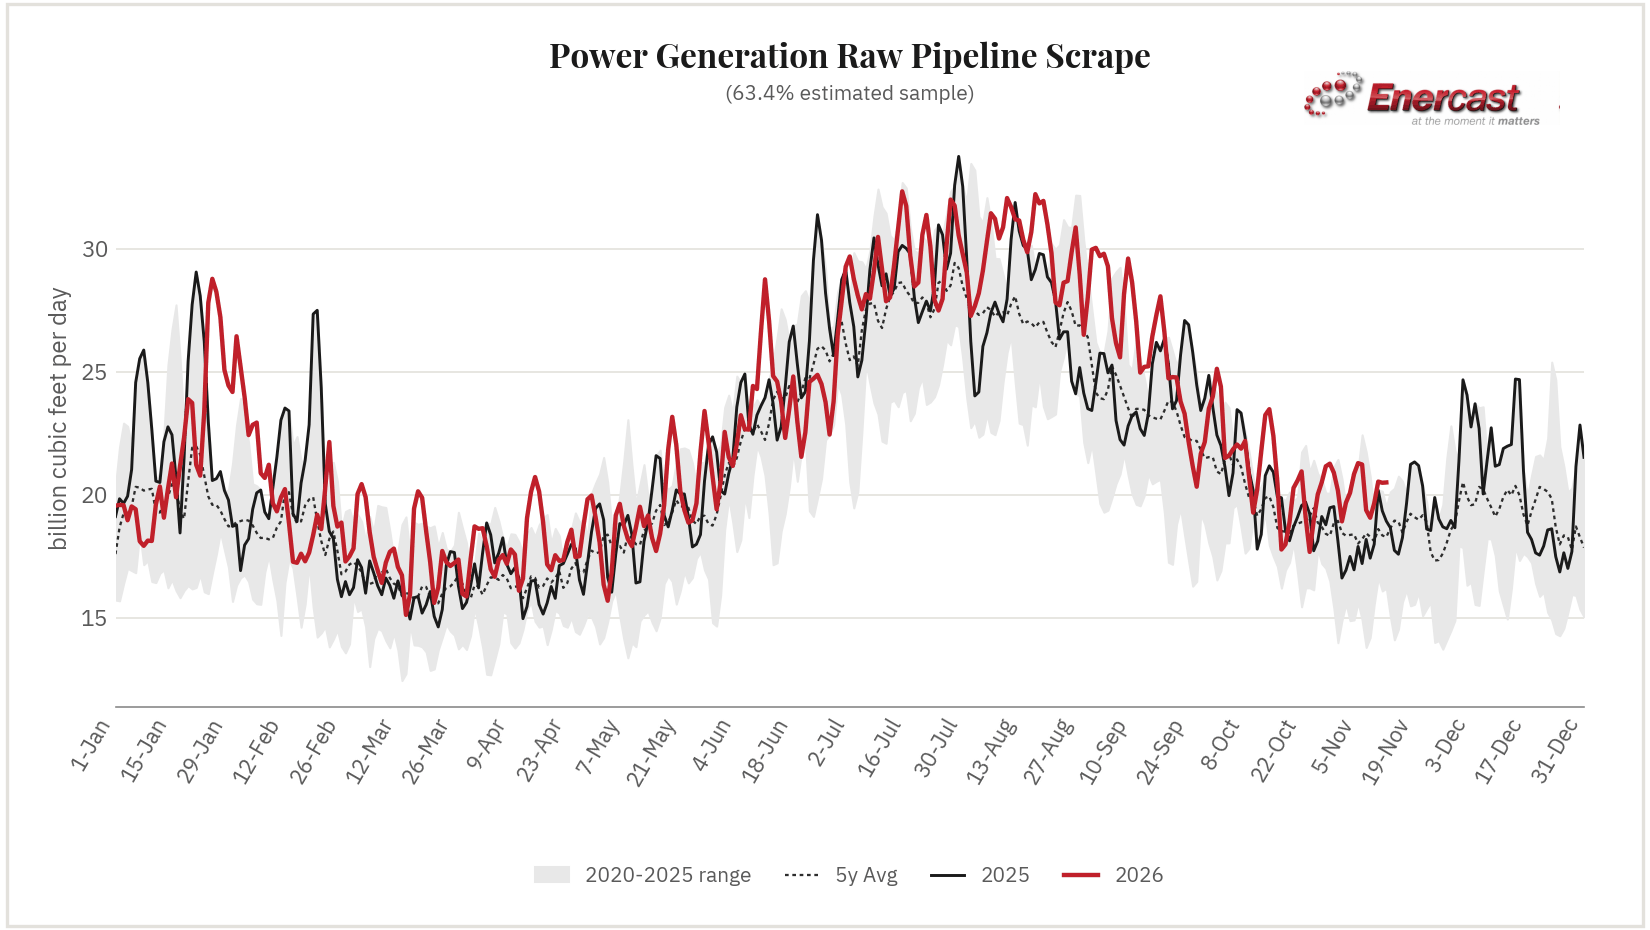
| Power Generation 63.4% Sample | 21.233 | 19.378 | 19.067 | 19.598 | 20.636 | +0.922 (+4.7%) | +0.080 (+0.4%) |
| Storage Sample unknown | +2.665 | +3.428 | +3.479 | +2.616 | +2.188 | -0.100 (-4.4%) | -0.185 (-6.2%) |
Gas day November 10, 2026 is today's gas day — not yet fully settled, and subject to revision as later cycles post.
| Meter / Interconnect | Pipeline | Location | Gas Day Bcf/d | Δ DoD | Δ 7d MA |
|---|---|---|---|---|---|
| ZICK M3659 MP 47.22 (receipt, gathering) | Transco | Pennsylvania | 1.103 | -0.002 (-0.2%) | -0.000 (-0.0%) |
| SHERWOOD (receipt, processing) | Rover Pipeline | West Virginia | 0.824 | -0.010 (-1.2%) | +0.011 (+1.3%) |
| APPLACHA/STAGEPS CHERRY RD SULLIVAN (receipt, gathering) | Stagecoach Pipeline and Storage | Pennsylvania | 0.812 | -0.012 (-1.5%) | -0.002 (-0.2%) |
| Sherwood - MXP (receipt, processing) | Columbia Gas Transmission (TCO) | West Virginia | 0.802 | -0.001 (-0.1%) | +0.004 (+0.5%) |
| BROADMORE RD. (receipt, intrastate_interconnect) | Columbia Gulf Transmission (CGT) | Louisiana | 0.740 | +0.036 (+5.1%) | +0.008 (+1.1%) |
| CARTHAGE HUB (receipt, intrastate_interconnect) | ETC Tiger Pipeline | Texas | 0.713 | -0.018 (-2.5%) | -0.000 (-0.0%) |
| APPLACHA/TGP UDP LIBERTY DEHY: RIP (receipt, gathering) | Tennessee Gas Pipeline (TGP) | Pennsylvania | 0.700 | -0.096 (-12.1%) | -0.014 (-1.8%) |
| COASTAL BEND ENTERPRISE INTERCONNECT (receipt, intrastate_interconnect) | Gulf South Pipeline | Texas | 0.684 | +0.041 (+6.4%) | +0.060 (+11.4%) |
View full detail → 1715 tracked locations for gas day
| Meter / Interconnect | Pipeline | Location | Gas Day Bcf/d | Δ DoD | Δ 7d MA |
|---|---|---|---|---|---|
| Plaquemines -- Gator Express terminal delivery | Venture Global Gator Express | Gulf Coast | 4.302 | -0.044 (-1.0%) | +0.002 (+0.0%) |
| Corpus Christi (Cheniere) | Corpus Christi LNG | Gulf Coast | 2.522 | -0.170 (-6.3%) | +0.022 (+0.8%) |
| Calcasieu Pass -- TransCameron terminal delivery | TransCameron Pipeline | Gulf Coast | 1.684 | -0.074 (-4.2%) | +0.000 (+0.0%) |
| Cameron -- CIP terminal delivery | Cameron Interstate Pipeline | Gulf Coast | 1.510 | -0.047 (-3.0%) | +0.000 (+0.0%) |
| Sabine Pass -- Creole Trail leg | Sabine Pass LNG | Gulf Coast | 1.483 | -0.003 (-0.2%) | -0.002 (-0.1%) |
| Freeport -- Gulf South Stratton Ridge leg | Gulf South Pipeline | Gulf Coast | 1.466 | -0.008 (-0.5%) | +0.119 (+10.0%) |
| Sabine Pass -- Transco Lighthouse Road delivery | Transco | Gulf Coast | 1.161 | -0.024 (-2.0%) | +0.023 (+2.0%) |
| Sabine -- KMLP terminal delivery | Kinder Morgan Louisiana Pipeline | Gulf Coast | 0.878 | -0.524 (-37.4%) | -0.072 (-5.1%) |
View full detail → 15 tracked locations for gas day
| Meter / Interconnect | Pipeline | Location | Gas Day Bcf/d | Δ DoD | Δ 7d MA |
|---|---|---|---|---|---|
| GTN Kingsgate | Gas Transmission Northwest | Pacific Northwest | 2.863 | +0.000 (+0.0%) | +0.004 (+0.1%) |
| Alliance Border USA -- import from Canada (Sherwood, ND) | Alliance Pipeline | Midwest | 1.930 | +0.000 (+0.0%) | +0.006 (+0.3%) |
| Great Lakes Emerson (receipt) | Great Lakes Gas Transmission | Upper Midwest | 1.736 | +0.053 (+3.1%) | +0.046 (+3.0%) |
| Northwest Sumas (receipt) | Northwest Pipeline | Pacific Northwest | 1.361 | +0.259 (+23.5%) | +0.039 (+3.4%) |
| Great Lakes St Clair (delivery to Ontario) | Great Lakes Gas Transmission | Upper Midwest | -0.762 | -0.025 (-3.4%) | -0.017 (-2.8%) |
| TGP Niagara (TRANSCAN UDP, delivery to TransCanada) | Tennessee Gas Pipeline (TGP) | Northeast | -0.544 | +0.000 (+0.0%) | -0.008 (-1.5%) |
| Vector St. Clair (US) -- export to Dawn, Ontario | Vector Pipeline | Midwest | -0.544 | -0.024 (-4.6%) | +0.030 (+5.2%) |
| Great Lakes St Clair (receipt from Ontario) | Great Lakes Gas Transmission | Upper Midwest | 0.518 | +0.075 (+16.9%) | +0.025 (+6.0%) |
View full detail → 16 tracked locations for gas day
| Meter / Interconnect | Pipeline | Location | Gas Day Bcf/d | Δ DoD | Δ 7d MA |
|---|---|---|---|---|---|
| North Baja -- Ogilby (border crossing to Baja California) | North Baja Pipeline | Southwest | 0.392 | -0.081 (-17.1%) | +0.002 (+0.4%) |
| TGP -- CENAGAS/PEMEX south delivery | Tennessee Gas Pipeline (TGP) | South Texas | 0.275 | +0.078 (+39.6%) | +0.006 (+2.8%) |
| TGP -- Rio Bravo (Hidalgo Co. crossing) | Tennessee Gas Pipeline (TGP) | South Texas | 0.259 | -0.005 (-1.9%) | +0.006 (+2.4%) |
| EPNG -- Mexicana de Cobre (Douglas AZ) | El Paso Natural Gas (EPNG) | Southwest | 0.074 | +0.000 (+0.0%) | -0.001 (-1.3%) |
| EPNG -- Willmex (CENAGAS, Cochise) | El Paso Natural Gas (EPNG) | Southwest | 0.035 | +0.000 (+0.0%) | +0.000 (+0.0%) |
| GASDEAGU/SIERRITA SASABE PIMA (delivery, mexico_border) | Sierrita Gas Pipeline (SGP) | Arizona | 0.028 | -0.014 (-32.9%) | -0.002 (-4.5%) |
| EPNG -- El Fresnal (CFE) | El Paso Natural Gas (EPNG) | Southwest | 0.021 | -0.019 (-47.1%) | -0.011 (-15.0%) |
| TGP -- Valley Crossing allocation | Tennessee Gas Pipeline (TGP) | South Texas | 0.000 | +0.000 | +0.000 |
View full detail → 8 tracked locations for gas day
| Meter / Interconnect | Pipeline | Location | Gas Day Bcf/d | Δ DoD | Δ 7d MA |
|---|---|---|---|---|---|
| WISCONSIN | ANR Pipeline (TC Energy) | WOOD, Wisconsin | 0.911 | +0.089 (+10.8%) | +0.046 (+5.9%) |
| NEW YORK FAC GROUP MP 1829.08 | Transco | Richmond, New York | 0.809 | -0.007 (-0.9%) | +0.020 (+2.9%) |
| NICORGAS/NGPL CDP | Natural Gas Pipeline (NGPL) | WILL, Illinois | 0.761 | -0.397 (-34.3%) | -0.051 (-4.3%) |
| SOCETS/MPC (SOCWR) WHEELER RIDGE | Mojave Pipeline (MOPC) | 0.548 | +0.168 (+44.2%) | +0.019 (+4.6%) | |
| SOCETS/MPC (KRAMER) KRAMER JCT DEL | Mojave Pipeline (MOPC) | 0.531 | +0.136 (+34.4%) | +0.020 (+5.1%) | |
| NIPSCO/NGPL CDP | Natural Gas Pipeline (NGPL) | COOK, Illinois | 0.490 | -0.079 (-13.9%) | -0.004 (-0.7%) |
| PUBLIC SERVICE E&G MP 1809.25 | Transco | Essex, New Jersey | 0.432 | -0.081 (-15.8%) | +0.009 (+2.2%) |
| PGLC/NGPL CDP | Natural Gas Pipeline (NGPL) | COOK, Illinois | 0.359 | -0.025 (-6.5%) | +0.005 (+1.3%) |
View full detail → 4060 tracked locations for gas day
| Meter / Interconnect | Pipeline | Location | Gas Day Bcf/d | Δ DoD | Δ 7d MA |
|---|---|---|---|---|---|
| MZX Deduct | Texas Gas Transmission | DE SOTO, Mississippi | 0.275 | +0.000 (+0.0%) | +0.000 (+0.0%) |
| Methanex Geismer 2 | Gulf South Pipeline | 0.188 | -0.000 (-0.0%) | +0.000 (+0.0%) | |
| GASTON / CENT AL - MULBERRY MP 902.41 | Transco | CHILTON, Alabama | 0.148 | -0.009 (-5.8%) | +0.001 (+0.7%) |
| FHR PINE BEND ROSEMOUNT MN COMPLEX | Northern Natural Gas | DAKOTA, Minnesota | 0.110 | +0.007 (+6.8%) | +0.002 (+2.0%) |
| SCAL - Pennsylvania Chemicals | National Fuel Gas Supply | BEAVER, Pennsylvania | 0.105 | +0.006 (+6.0%) | +0.005 (+6.4%) |
| WRB REFINING LP | Enable Mississippi River Transmission (MRT) | MADISON, Illinois | 0.090 | +0.001 (+1.1%) | +0.001 (+1.2%) |
| OLD RIVER ROAD M4675 MP 0.49 | Transco | ST JAMES, Louisiana | 0.086 | +0.007 (+8.8%) | +0.000 (+0.0%) |
| BURKES RUN | ANR Pipeline (TC Energy) | Lee, Iowa | 0.082 | -0.005 (-5.8%) | -0.001 (-1.1%) |
View full detail → 1347 tracked locations for gas day
| Meter / Interconnect | Pipeline | Location | Gas Day Bcf/d | Δ DoD | Δ 7d MA |
|---|---|---|---|---|---|
| West County MP 34.1 | Gulfstream Natural Gas System | 0.406 | -0.004 (-1.0%) | -0.005 (-1.2%) | |
| TUIP to Union Power Plant | Trans-Union Interstate Pipeline | 0.331 | -0.013 (-3.8%) | +0.008 (+2.3%) | |
| Ft Myers-FPL | Florida Gas Transmission | 0.299 | +0.073 (+32.3%) | +0.012 (+4.6%) | |
| Lawrenceburg Power Plant | Texas Gas Transmission | 0.278 | -0.007 (-2.5%) | +0.000 (+0.0%) | |
| Dynegy Lake Road (Windham,CT) | Algonquin Gas Transmission | 0.276 | +0.151 (+121.1%) | +0.021 (+16.8%) | |
| SO CO/SNG PLANT MCDONOUGH COBB (Georgia Power Co) | Southern Natural Gas | Fulton County (WRI geocode; meter says Cobb -- see note), GA | 0.275 | -0.010 (-3.5%) | -0.004 (-1.4%) |
| SRP/EPNG (DSRP PHX) MARICOPA | El Paso Natural Gas (EPNG) | 0.275 | +0.019 (+7.4%) | +0.017 (+7.4%) | |
| BBT BAMA/TGP BAMAGAS COLBERT | Tennessee Gas Pipeline (TGP) | 0.266 | +0.026 (+10.8%) | +0.005 (+2.0%) |
View full detail → 565 tracked locations for gas day
| Meter / Interconnect | Pipeline | Location | Gas Day Bcf/d | Δ DoD | Δ 7d MA |
|---|---|---|---|---|---|
| CVP STORAGE POINT (withdrawal, CPL) | CPL | Northeast | +0.875 | +0.000 (+0.0%) | +0.000 (+0.0%) |
| Egan <-> Texas Eastern storage account (withdrawal, Egan Hub Storage) | Egan Hub Storage | Gulf Coast | +0.449 | -0.218 (-126.5%) | -0.031 (-14.4%) |
| Tx_Gas_SL (net injection/withdrawal, storage) | Pine Prairie Energy Center | Louisiana | -0.427 | -0.062 (-17.0%) | -0.012 (-3.3%) |
| Enstor Katy Storage (withdrawal, Gulf South Pipeline) | Gulf South Pipeline | Gulf Coast | +0.393 | -0.027 (-6.4%) | +0.020 (+5.5%) |
| Egan <-> Texas Eastern storage account (injection, Egan Hub Storage) | Egan Hub Storage | Gulf Coast | -0.391 | -0.218 (-126.5%) | -0.031 (-14.4%) |
| Monroe Gas Storage (injection, Texas Eastern Transmission (TETCO)) | Texas Eastern Transmission (TETCO) | Appalachia | -0.385 | -0.028 (-7.8%) | +0.005 (+1.2%) |
| Monroe Gas Storage (TGP interconnect) (withdrawal, Tennessee Gas Pipeline (TGP)) | Tennessee Gas Pipeline (TGP) | Northeast | +0.373 | +0.044 (+13.3%) | +0.001 (+0.3%) |
| Moss Bluff Gas Storage (Chambers Co., TX) (withdrawal, Texas Eastern Transmission (TETCO)) | Texas Eastern Transmission (TETCO) | Gulf Coast | +0.336 | +0.146 (+76.9%) | +0.027 (+16.4%) |
View full detail → 274 tracked locations for gas day
Get this data
- CSV / RSS feed — coming soon
- Embed / badge snippet & license terms — coming soon
- Pro real-time access →
Recent days
Free for non-commercial reuse with attribution and a live, followed link to this page; commercial use and automated collection need permission (see the Terms of Use). Figures are PipeScrape's own scraped totals from monitored interstate pipelines; comparison percentages are against the national supply/demand benchmark where available. Gas day November 10, 2026 reflects same-day (T0) data as of publish time 2026-11-10 05:15 local; figures may be revised as later nomination cycles post. Day-over-day compares each gas day at the same point in its posting cycle, so it is not the difference between the two dated columns — earlier days have since settled upward as later cycles posted.