
Posted Quantities, Not Estimates
Every figure on these pages is a posted scheduled quantity — the volume a pipeline published at a named meter, on a named cycle, added up. Not measured flow, not a model: what the pipeline posted. Nothing is scaled to a national total (LNG Canada, a labeled exception, is derived).
For a trader the question is rarely “what is U.S. power burn today?” It is “what changed since yesterday, where, and is it real?” Postings answer all three better than a scaled-up estimate: the figure is available as each cycle closes, at the point where the gas moved, with the filing to prove it. Our own tests showed that scaling our data up to match a national estimate produced a number no better than the estimate, published later — so we stopped.
We cover the interstate system, not the whole country. Texas intrastate pipelines, customers behind LDC citygates and the California utilities don’t post the same way, so those flows are not in our totals yet. We are adding additional meters and pipelines every week, each validated before it counts, so coverage keeps rising. What we won’t do is invent the rest.
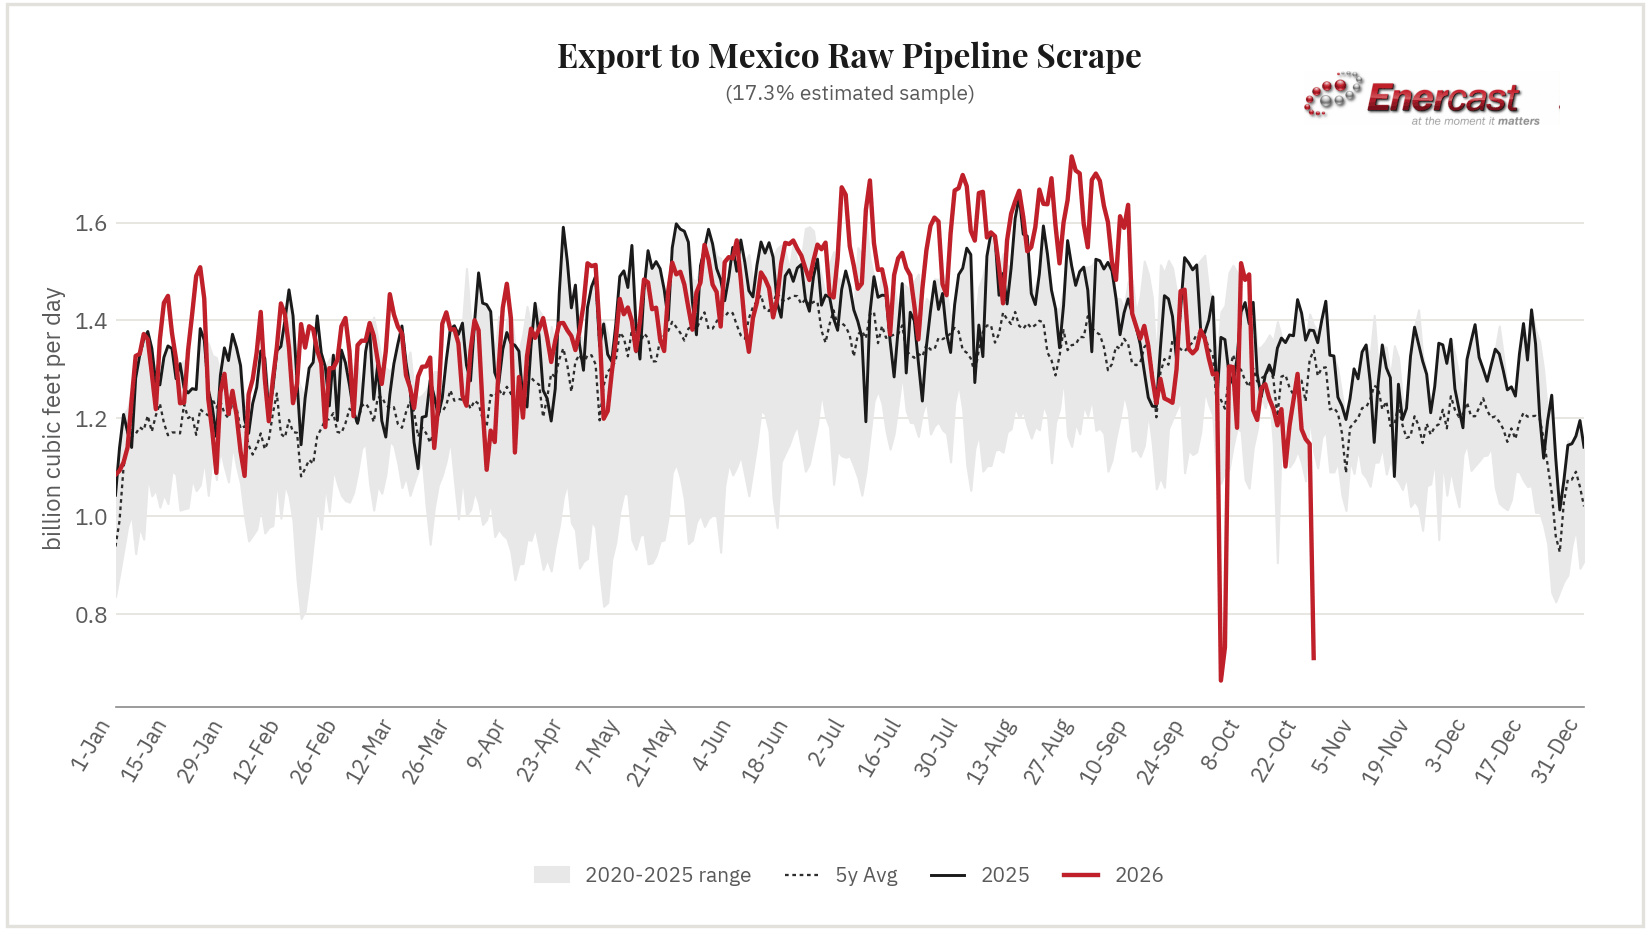
Reflects directly-metered interstate pipeline flows — most U.S.-to-Mexico export capacity moves through Texas intrastate pipelines that don't publicly report data, not a gap PipeScrape can close.
| Category | Oct-20 | Oct-21 | Oct-22 | Oct-23 | Oct-24 | Oct-25 | Δ DoDvs. same cycle | Δ 7d MA |
|---|---|---|---|---|---|---|---|---|
| Export to Mexico | 1.238 | 1.291 | 1.178 | 1.158 | 1.148 | 1.106 | -0.038 (-3.3%) | +0.001 (+0.1%) |
Updated daily by 7:30 AM ET for free subscribers — Pro subscribers get this update by 2:45 AM ET, plus Intra‑Day change alerts.
| Pipeline | Meter / Interconnect | Location | Gas Day Bcf/d | Δ DoD | Δ 7d MA |
|---|---|---|---|---|---|
| North Baja Pipeline | North Baja -- Ogilby (border crossing to Baja California) | Southwest | 0.446 | -0.048 (-9.7%) | -0.001 (-0.2%) |
| Tennessee Gas Pipeline (TGP) | TGP -- Rio Bravo (Hidalgo Co. crossing) | South Texas | 0.232 | +0.012 (+5.5%) | -0.003 (-1.2%) |
| Tennessee Gas Pipeline (TGP) | TGP -- CENAGAS/PEMEX south delivery | South Texas | 0.163 | -0.006 (-3.5%) | +0.005 (+3.0%) |
| El Paso Natural Gas (EPNG) | EPNG -- El Fresnal (CFE) | Southwest | 0.113 | +0.000 (+0.0%) | +0.002 (+1.9%) |
| El Paso Natural Gas (EPNG) | EPNG -- Mexicana de Cobre (Douglas AZ) | Southwest | 0.074 | +0.000 (+0.0%) | -0.004 (-4.5%) |
| Sierrita Gas Pipeline (SGP) | GASDEAGU/SIERRITA SASABE PIMA (delivery, mexico_border) | Arizona | 0.043 | +0.000 (+0.0%) | +0.001 (+2.4%) |
| El Paso Natural Gas (EPNG) | EPNG -- Willmex (CENAGAS, Cochise) | Southwest | 0.035 | +0.000 (+0.0%) | +0.000 (+0.0%) |
| Tennessee Gas Pipeline (TGP) | TGP -- Valley Crossing allocation | South Texas | 0.000 | +0.000 | +0.000 |
Showing all 8 locations in PipeScrape's registry for this category that posted a real capacity_postings figure for this gas day — the entire tracked universe, not a sample. Each value is that meter's own real, measured scheduled quantity for this gas day (not an estimate or apportionment).