
| Category | Oct-23 | Oct-24 | Oct-25 | Oct-26 | Oct-27 | Δ DoDvs. same cycle | Δ 7d MA |
|---|---|---|---|---|---|---|---|
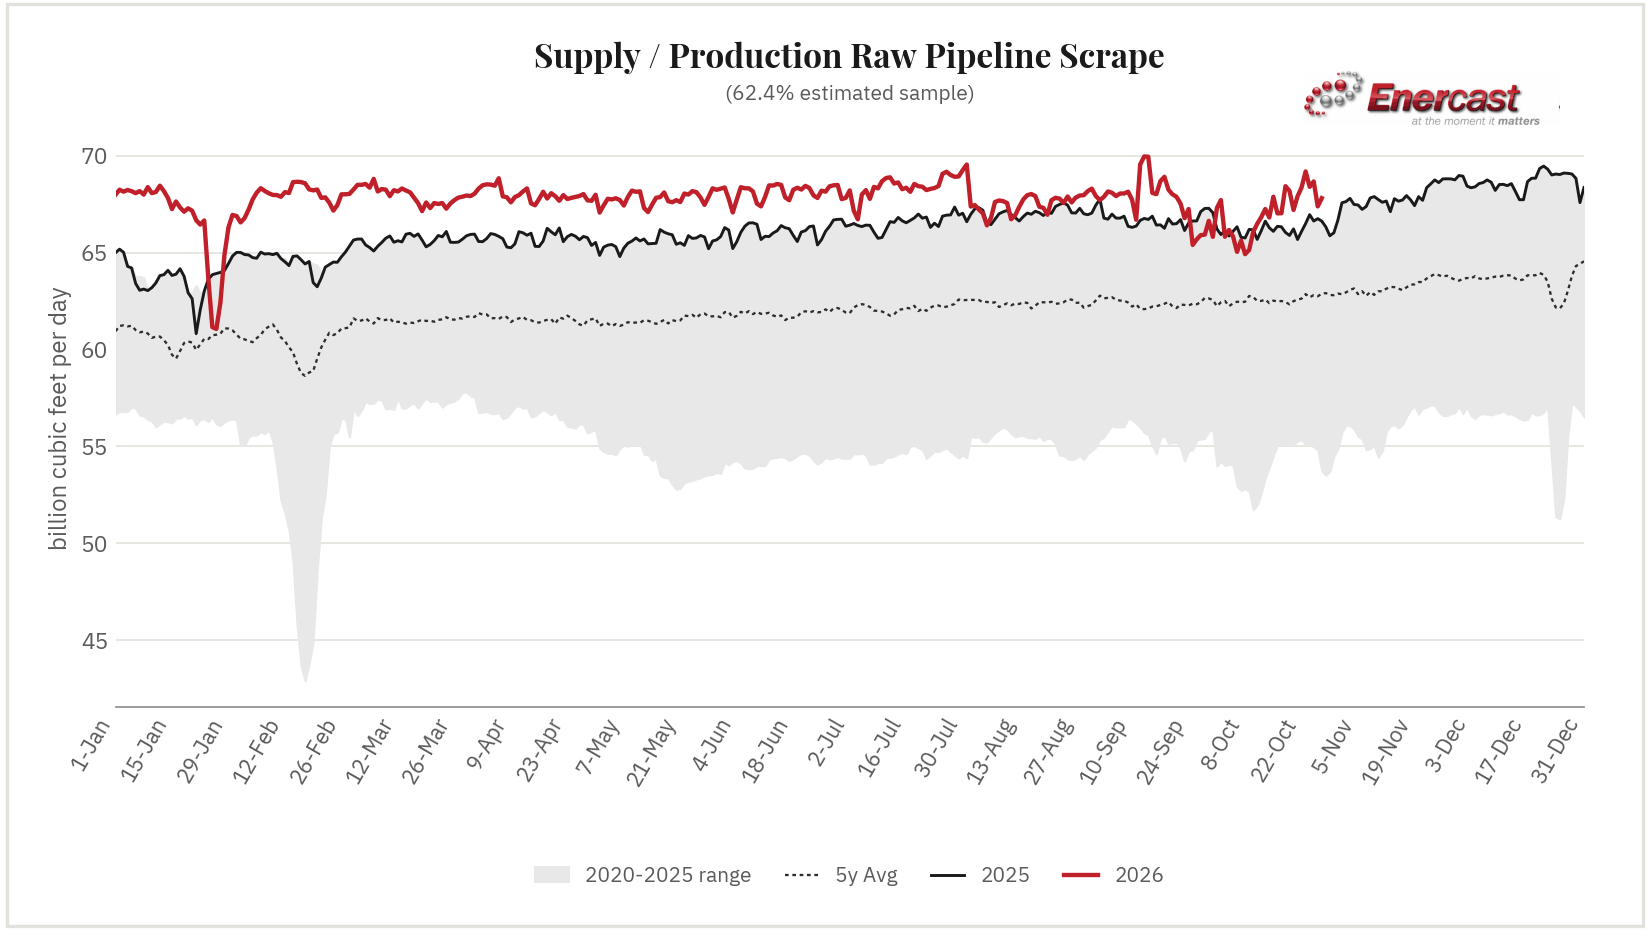
| Supply / Production 62.4% Sample | 69.184 | 68.391 | 68.665 | 67.381 | 67.804 | +0.310 (+0.5%) | +0.087 (+0.1%) |
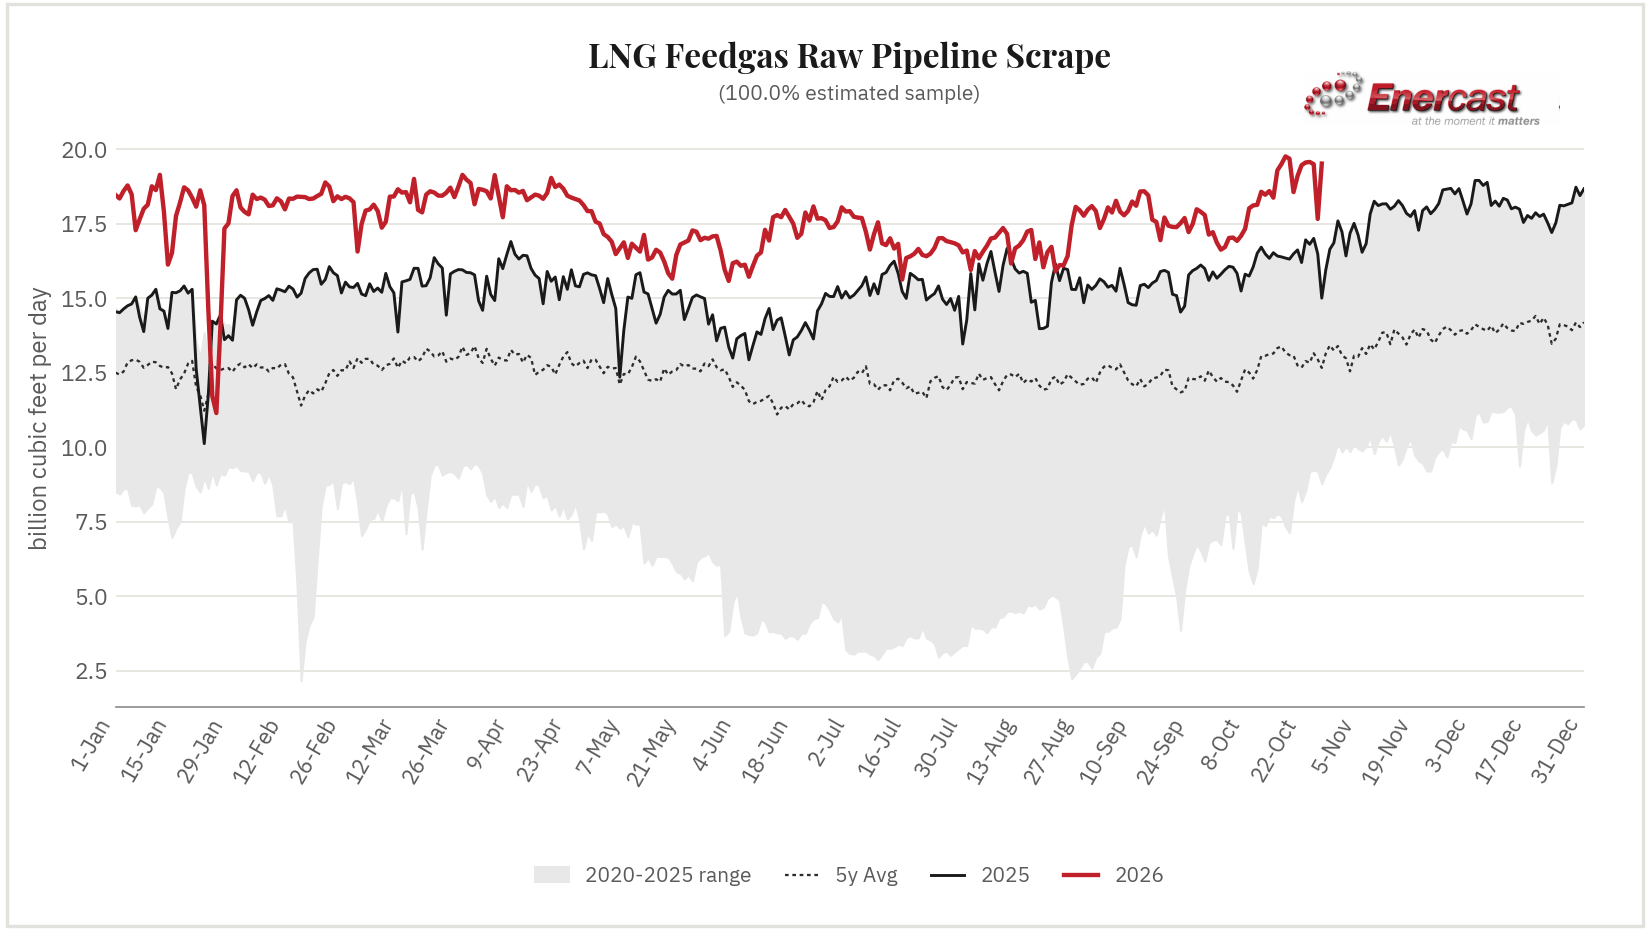
| LNG Feedgas 100.0% Sample | 19.552 | 19.570 | 19.496 | 17.658 | 19.515 | +0.168 (+0.9%) | +0.137 (+0.7%) |
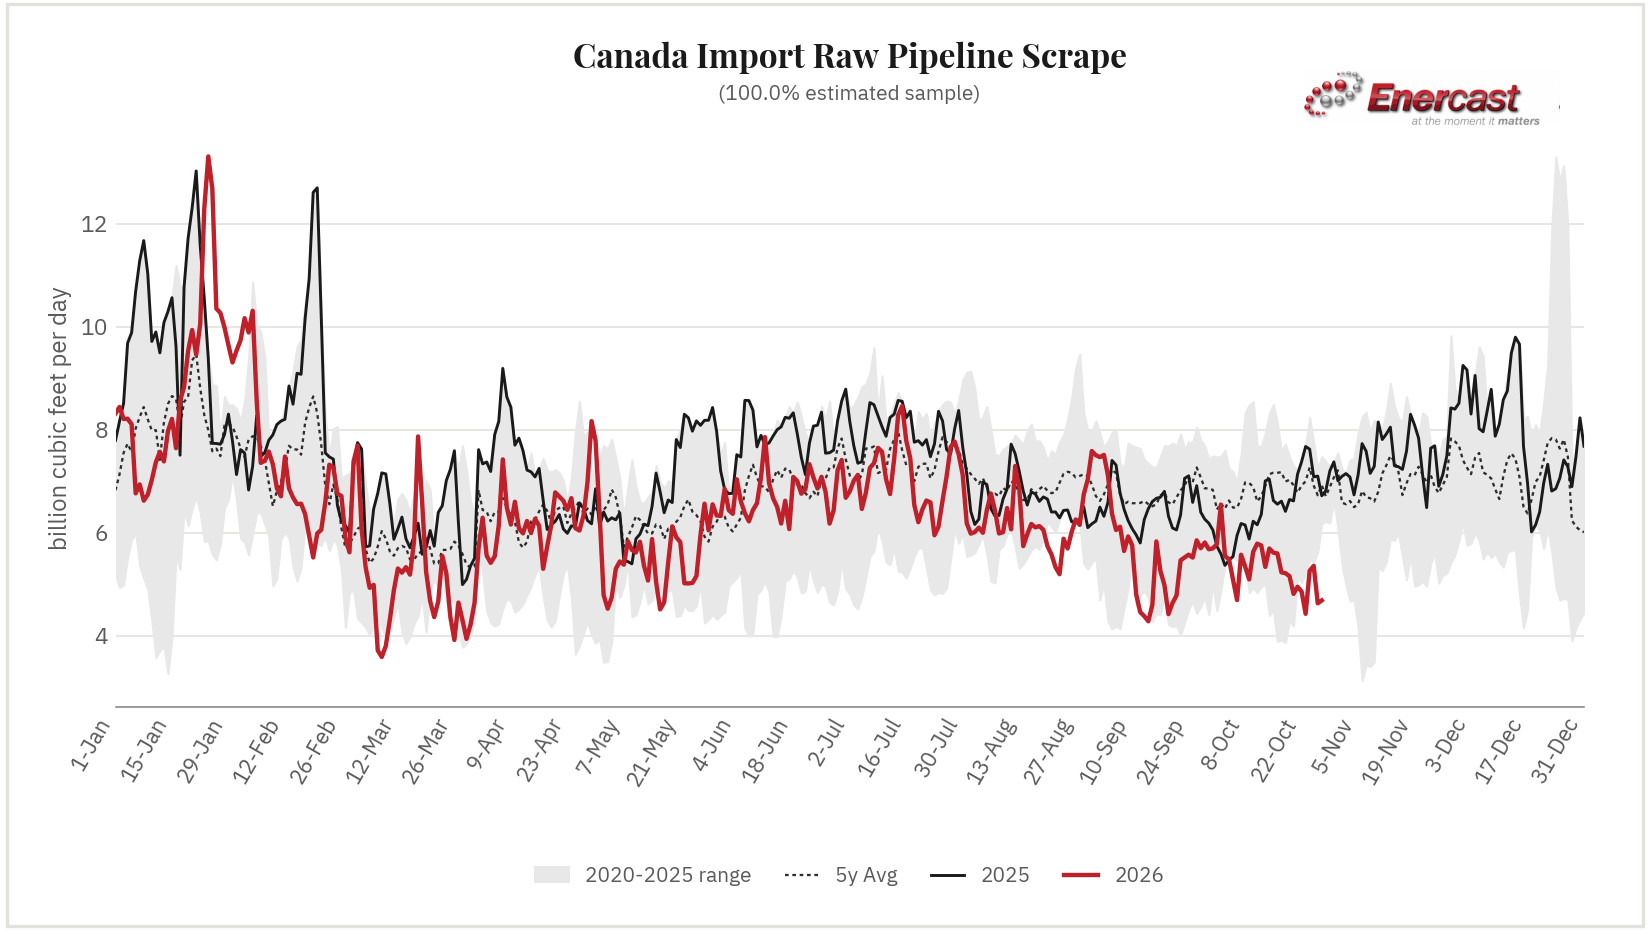
| Canada Import 100.0% Sample | 4.428 | 5.264 | 5.359 | 4.632 | 4.688 | +0.366 (+8.5%) | -0.018 (-0.4%) |
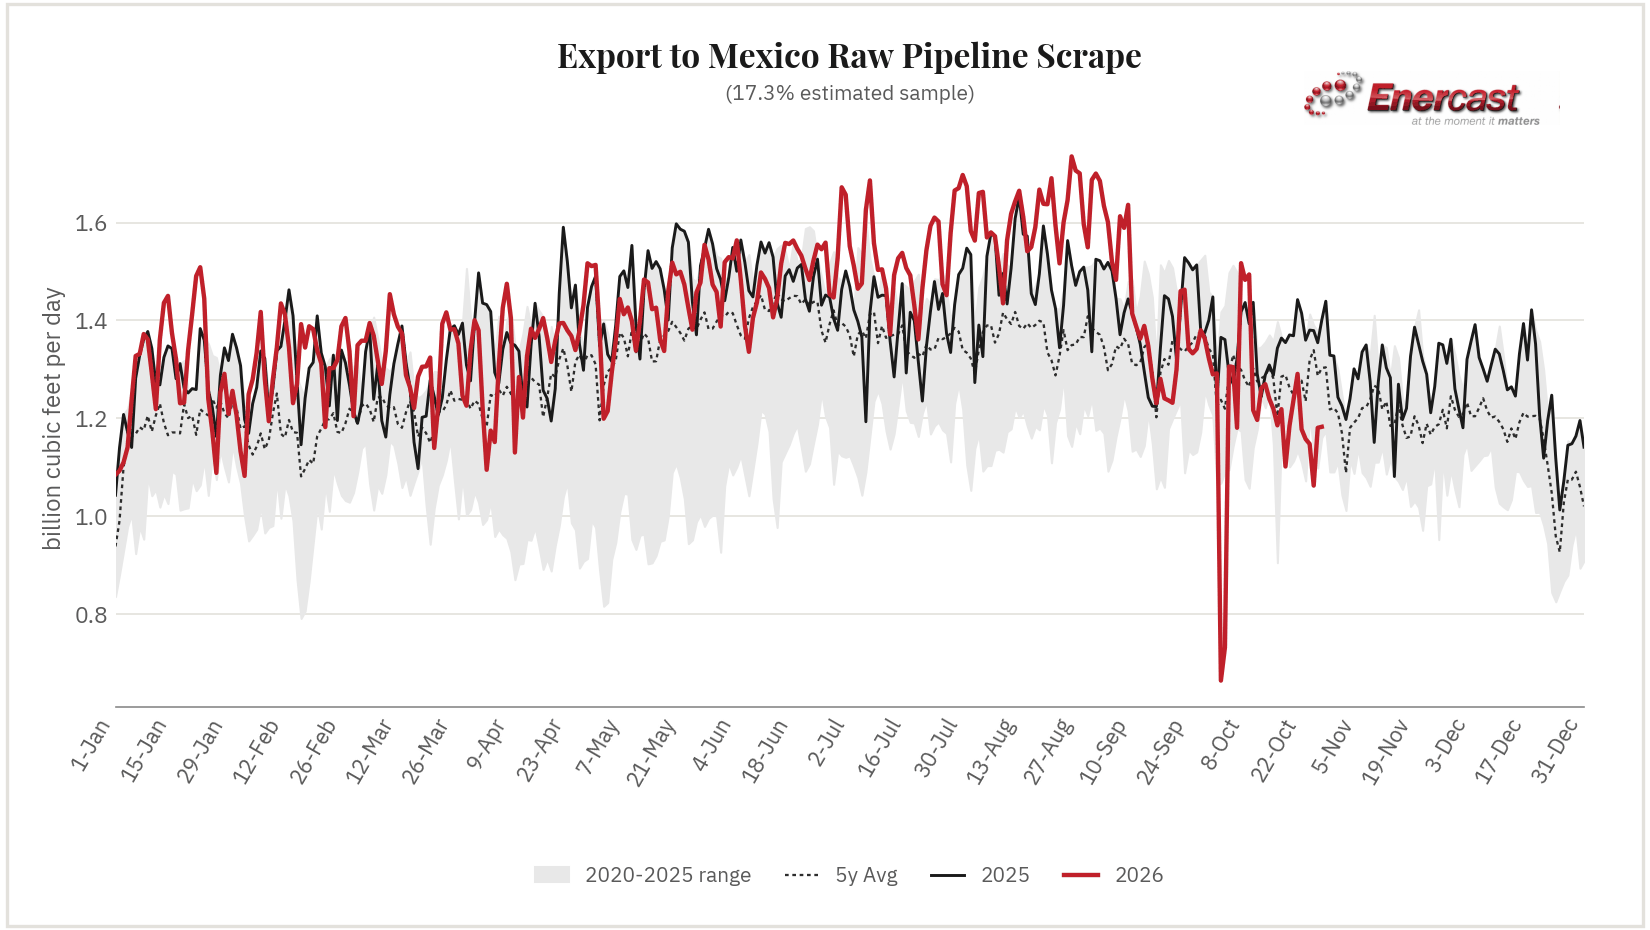
| Export to Mexico 17.3% Sample | 1.158 | 1.148 | 1.063 | 1.181 | 1.183 | +0.000 (+0.0%) | -0.008 (-0.7%) |
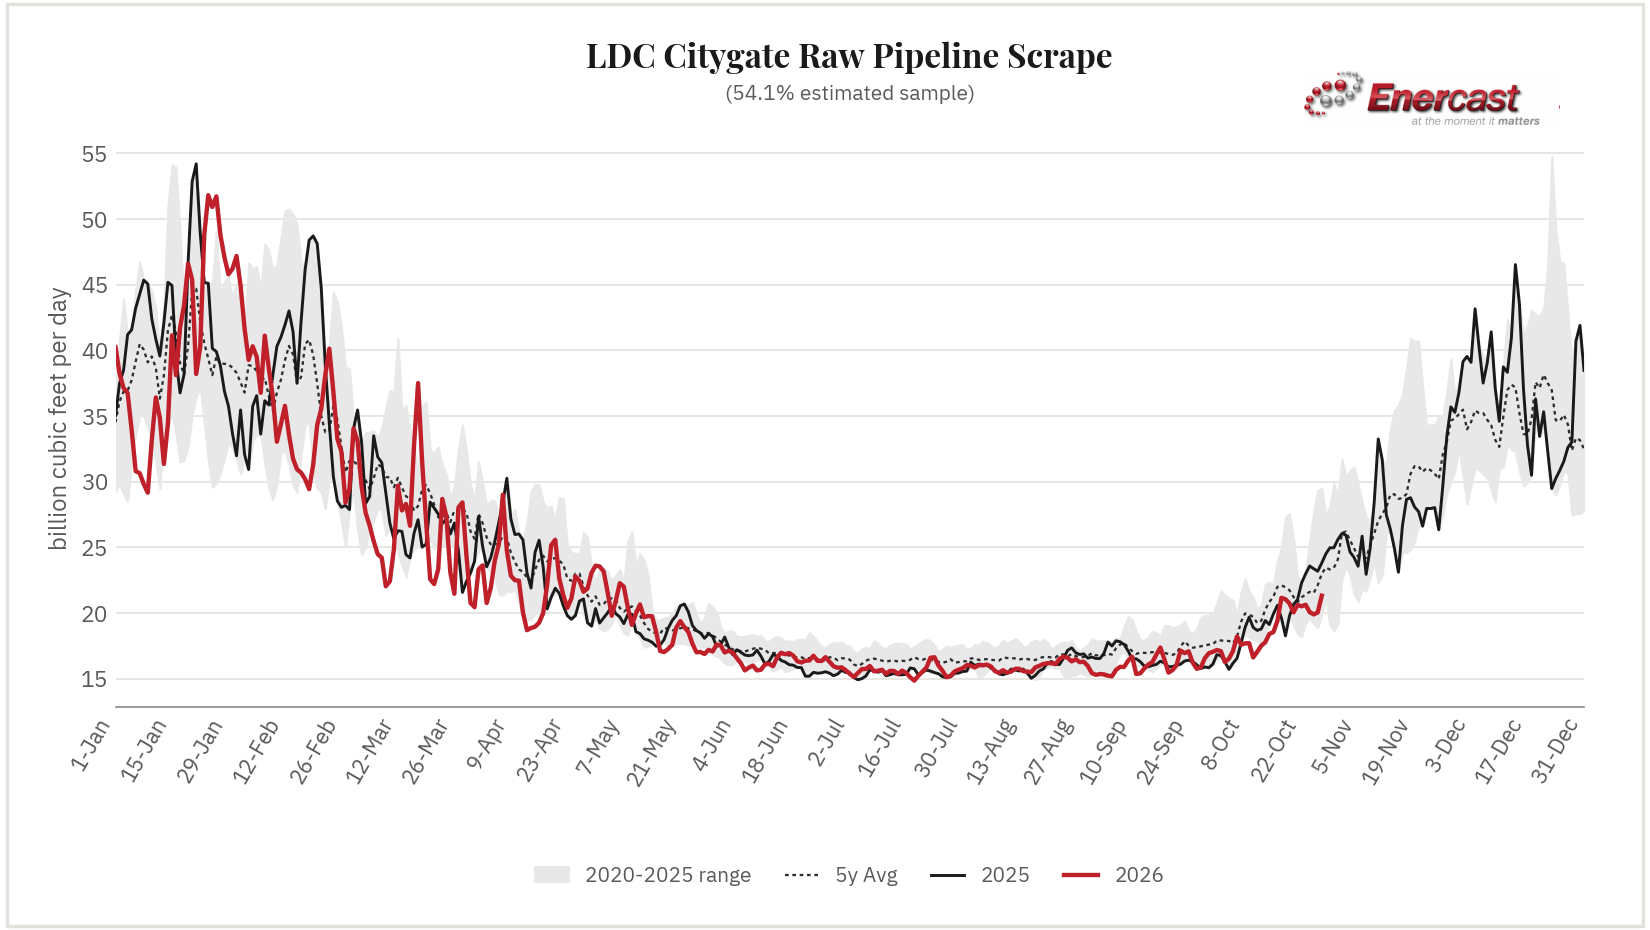
| LDC Citygate 54.1% Sample | 20.640 | 20.074 | 19.902 | 20.054 | 21.327 | +1.882 (+9.7%) | +0.181 (+0.9%) |
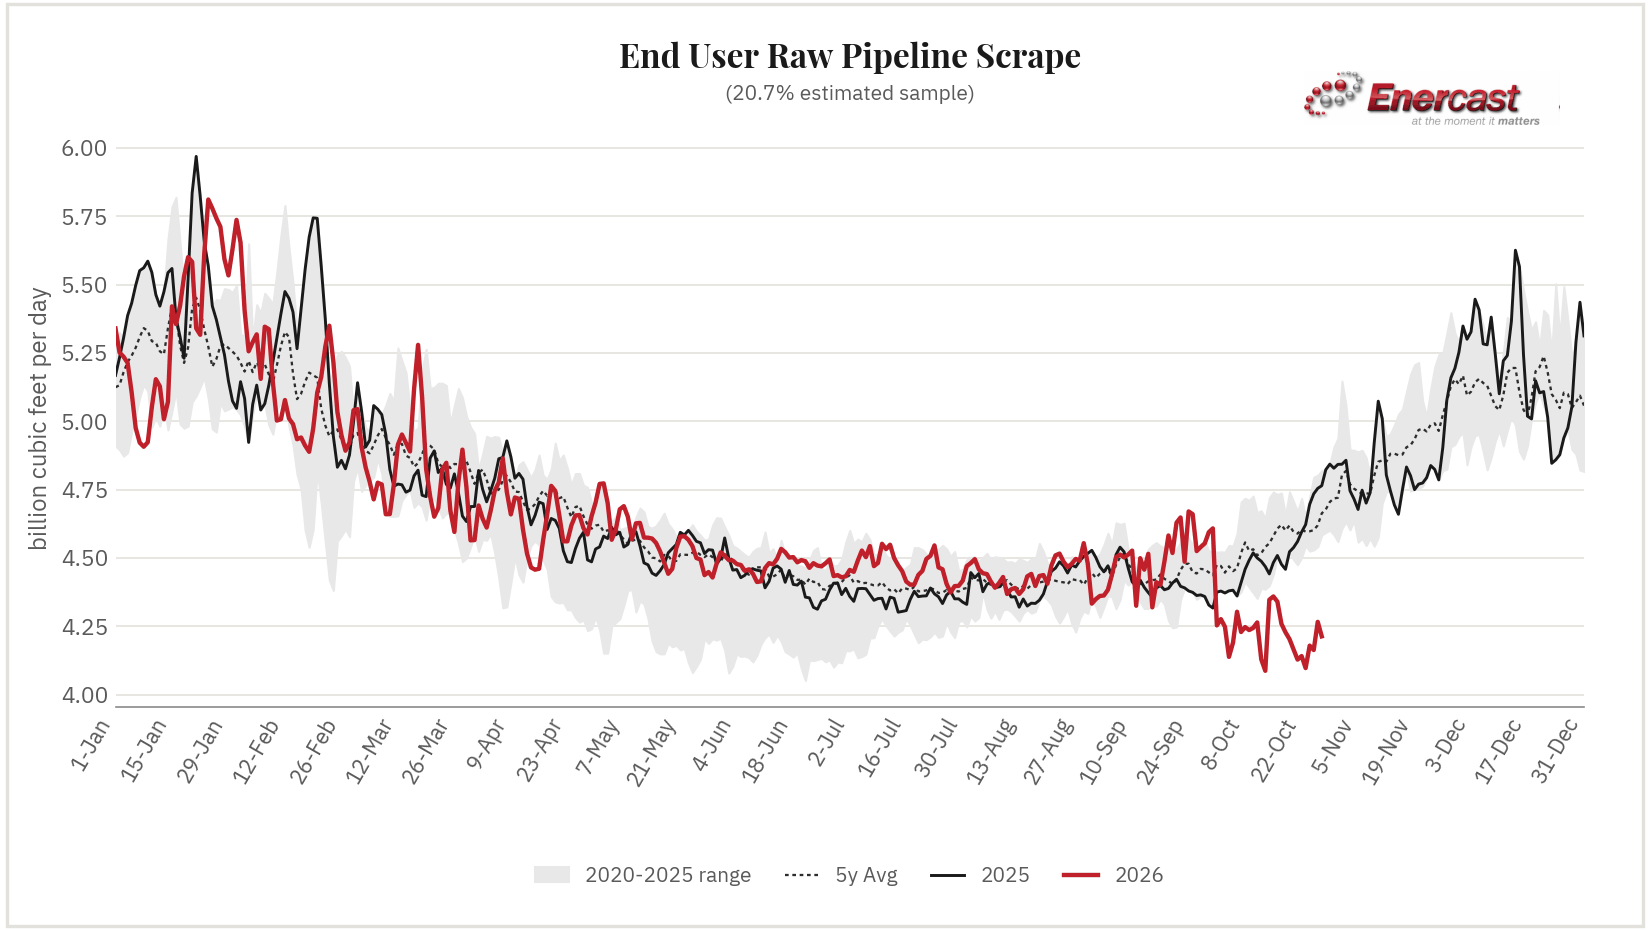
| End User 20.7% Sample | 4.097 | 4.179 | 4.163 | 4.266 | 4.213 | +0.073 (+1.8%) | +0.007 (+0.2%) |
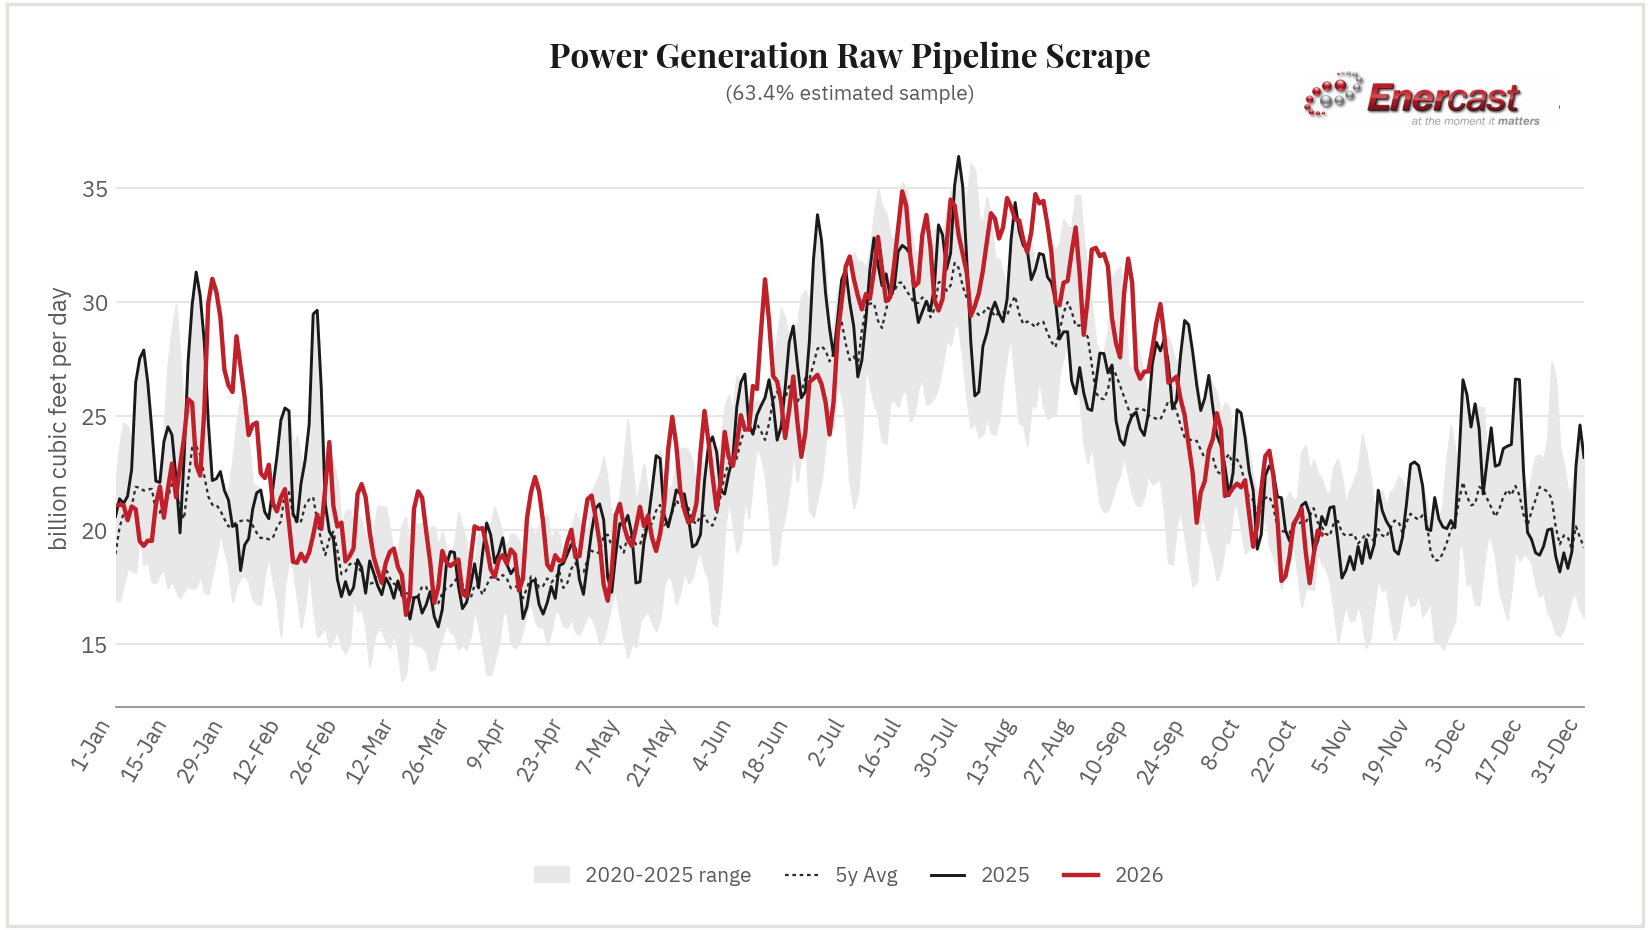
| Power Generation 63.4% Sample | 19.083 | 17.677 | 18.943 | 19.986 | 19.816 | +1.191 (+6.4%) | -0.066 (-0.3%) |
| Storage Sample unknown | +7.273 | +7.574 | +7.107 | +5.674 | +4.589 * | -1.595 (-25.8%) | -0.185 (-2.9%) |
* Storage: UGI Storage has not published updated data for today.
Gas day October 27, 2026 is today's gas day — not yet fully settled, and subject to revision as later cycles post.
| Meter / Interconnect | Pipeline | Location | Gas Day Bcf/d | Δ DoD | Δ 7d MA |
|---|---|---|---|---|---|
| Pineville (receipt, intrastate_interconnect) | Texas Gas Transmission | Louisiana | 1.204 | -0.007 (-0.6%) | -0.001 (-0.1%) |
| ZICK M3659 MP 47.22 (receipt, gathering) | Transco | Pennsylvania | 1.061 | -0.045 (-4.1%) | -0.006 (-0.5%) |
| APPLACHA/TGP UDP LIBERTY DEHY: RIP (receipt, gathering) | Tennessee Gas Pipeline (TGP) | Pennsylvania | 0.874 | +0.050 (+6.1%) | -0.001 (-0.1%) |
| APPLACHA/STAGEPS CHERRY RD SULLIVAN (receipt, gathering) | Stagecoach Pipeline and Storage | Pennsylvania | 0.824 | +0.000 (+0.0%) | +0.000 (+0.0%) |
| SHERWOOD (receipt, processing) | Rover Pipeline | West Virginia | 0.822 | -0.017 (-2.0%) | -0.002 (-0.2%) |
| TOMBS RUN M3610 MP 174.05 (receipt, gathering) | Transco | Pennsylvania | 0.787 | +0.089 (+12.8%) | +0.008 (+1.1%) |
| Sherwood - MXP (receipt, processing) | Columbia Gas Transmission (TCO) | West Virginia | 0.780 | +0.002 (+0.3%) | +0.001 (+0.1%) |
| EQM GATHERING - BONNETHEAD (BI-DI D 74110/R 74111) (receipt, gathering) | Texas Eastern Transmission (TETCO) | Pennsylvania | 0.751 | +0.198 (+35.8%) | +0.003 (+0.4%) |
View full detail → 1750 tracked locations for gas day
| Meter / Interconnect | Pipeline | Location | Gas Day Bcf/d | Δ DoD | Δ 7d MA |
|---|---|---|---|---|---|
| Plaquemines -- Gator Express terminal delivery | Venture Global Gator Express | Gulf Coast | 4.351 | +0.014 (+0.3%) | +0.003 (+0.1%) |
| Corpus Christi (Cheniere) | Corpus Christi LNG | Gulf Coast | 2.752 | +0.112 (+4.2%) | +0.027 (+1.0%) |
| Calcasieu Pass -- TransCameron terminal delivery | TransCameron Pipeline | Gulf Coast | 1.682 | -0.039 (-2.3%) | +0.008 (+0.5%) |
| Sabine Pass -- Creole Trail leg | Sabine Pass LNG | Gulf Coast | 1.525 | -0.015 (-1.0%) | -0.005 (-0.3%) |
| Cameron -- CIP terminal delivery | Cameron Interstate Pipeline | Gulf Coast | 1.522 | -0.024 (-1.6%) | +0.053 (+3.6%) |
| Sabine -- KMLP terminal delivery | Kinder Morgan Louisiana Pipeline | Gulf Coast | 1.421 | -0.106 (-6.9%) | -0.017 (-1.1%) |
| Freeport -- Gulf South Stratton Ridge leg | Gulf South Pipeline | Gulf Coast | 1.347 | +1.347 | +0.047 (+4.1%) |
| Sabine Pass -- Transco Lighthouse Road delivery | Transco | Gulf Coast | 1.174 | -0.025 (-2.1%) | +0.000 (+0.0%) |
View full detail → 15 tracked locations for gas day
| Meter / Interconnect | Pipeline | Location | Gas Day Bcf/d | Δ DoD | Δ 7d MA |
|---|---|---|---|---|---|
| GTN Kingsgate | Gas Transmission Northwest | Pacific Northwest | 2.099 | -0.001 (-0.0%) | -0.033 (-1.3%) |
| Alliance Border USA -- import from Canada (Sherwood, ND) | Alliance Pipeline | Midwest | 1.799 | -0.000 (-0.0%) | +0.016 (+0.9%) |
| Great Lakes Emerson (receipt) | Great Lakes Gas Transmission | Upper Midwest | 1.399 | +0.274 (+24.3%) | +0.039 (+3.4%) |
| Northwest Sumas (receipt) | Northwest Pipeline | Pacific Northwest | 0.889 | -0.052 (-5.5%) | +0.002 (+0.2%) |
| Vector St. Clair (US) -- export to Dawn, Ontario | Vector Pipeline | Midwest | -0.703 | -0.025 (-3.7%) | -0.024 (-3.8%) |
| Great Lakes St Clair (delivery to Ontario) | Great Lakes Gas Transmission | Upper Midwest | -0.605 | -0.107 (-21.5%) | -0.012 (-2.1%) |
| TGP Niagara (TRANSCAN UDP, delivery to TransCanada) | Tennessee Gas Pipeline (TGP) | Northeast | -0.569 | +0.010 (+1.7%) | +0.002 (+0.3%) |
| Viking Emerson -- import from Canada (Kittson County, MN; TC Mainline delivery to Viking, alongside Great Lakes Emerson 33975) | Viking Gas Transmission | Upper Midwest | 0.504 | -0.007 (-1.4%) | -0.001 (-0.2%) |
View full detail → 16 tracked locations for gas day
| Meter / Interconnect | Pipeline | Location | Gas Day Bcf/d | Δ DoD | Δ 7d MA |
|---|---|---|---|---|---|
| North Baja -- Ogilby (border crossing to Baja California) | North Baja Pipeline | Southwest | 0.445 | -0.060 (-11.9%) | -0.016 (-3.1%) |
| TGP -- Rio Bravo (Hidalgo Co. crossing) | Tennessee Gas Pipeline (TGP) | South Texas | 0.217 | -0.014 (-6.1%) | -0.005 (-2.2%) |
| TGP -- CENAGAS/PEMEX south delivery | Tennessee Gas Pipeline (TGP) | South Texas | 0.199 | +0.019 (+10.6%) | +0.007 (+4.1%) |
| EPNG -- El Fresnal (CFE) | El Paso Natural Gas (EPNG) | Southwest | 0.106 | +0.009 (+9.2%) | +0.001 (+0.9%) |
| EPNG -- Mexicana de Cobre (Douglas AZ) | El Paso Natural Gas (EPNG) | Southwest | 0.074 | +0.000 (+0.0%) | -0.004 (-4.9%) |
| GASDEAGU/SIERRITA SASABE PIMA (delivery, mexico_border) | Sierrita Gas Pipeline (SGP) | Arizona | 0.057 | -0.002 (-3.4%) | +0.002 (+4.3%) |
| TGP -- Valley Crossing allocation | Tennessee Gas Pipeline (TGP) | South Texas | 0.051 | +0.051 | +0.007 |
| EPNG -- Willmex (CENAGAS, Cochise) | El Paso Natural Gas (EPNG) | Southwest | 0.035 | +0.000 (+0.0%) | +0.000 (+0.0%) |
View full detail → 8 tracked locations for gas day
| Meter / Interconnect | Pipeline | Location | Gas Day Bcf/d | Δ DoD | Δ 7d MA |
|---|---|---|---|---|---|
| NICORGAS/NGPL CDP | Natural Gas Pipeline (NGPL) | WILL, Illinois | 1.034 | +0.073 (+7.6%) | -0.000 (-0.0%) |
| NEW YORK FAC GROUP MP 1829.08 | Transco | Richmond, New York | 0.732 | +0.081 (+12.4%) | +0.010 (+1.4%) |
| PUBLIC SERVICE E&G MP 1809.25 | Transco | Essex, New Jersey | 0.591 | +0.070 (+13.5%) | +0.009 (+1.7%) |
| SOCETS/MPC (SOCWR) WHEELER RIDGE | Mojave Pipeline (MOPC) | 0.515 | +0.067 (+15.0%) | +0.003 (+0.7%) | |
| SOCETS/MPC (KRAMER) KRAMER JCT DEL | Mojave Pipeline (MOPC) | 0.461 | +0.030 (+7.0%) | +0.002 (+0.5%) | |
| NIPSCO/NGPL CDP | Natural Gas Pipeline (NGPL) | COOK, Illinois | 0.451 | +0.016 (+3.7%) | +0.001 (+0.2%) |
| WISCONSIN | ANR Pipeline (TC Energy) | WOOD, Wisconsin | 0.443 | +0.077 (+21.1%) | +0.004 (+1.1%) |
| Public Service - Linden, NJ | Texas Eastern Transmission (TETCO) | UNION, New Jersey | 0.255 | +0.030 (+13.4%) | +0.002 (+0.8%) |
View full detail → 4058 tracked locations for gas day
| Meter / Interconnect | Pipeline | Location | Gas Day Bcf/d | Δ DoD | Δ 7d MA |
|---|---|---|---|---|---|
| Methanex Geismer 2 | Gulf South Pipeline | 0.185 | +0.004 (+2.2%) | +0.003 (+1.6%) | |
| GASTON / CENT AL - MULBERRY MP 902.41 | Transco | CHILTON, Alabama | 0.145 | +0.017 (+13.2%) | +0.013 (+43.7%) |
| CF INDUSTRIES PORT NEAL 2 | Northern Natural Gas | WOODBURY, Iowa | 0.098 | +0.005 (+5.4%) | -0.000 (-0.0%) |
| Port Arthur-Motiva | Florida Gas Transmission | JEFFERSON, Texas | 0.097 | -0.030 (-23.7%) | +0.008 (+7.0%) |
| WRB REFINING LP | Enable Mississippi River Transmission (MRT) | MADISON, Illinois | 0.092 | -0.004 (-4.2%) | -0.003 (-3.0%) |
| FHR PINE BEND ROSEMOUNT MN COMPLEX | Northern Natural Gas | DAKOTA, Minnesota | 0.086 | -0.025 (-22.6%) | -0.002 (-1.9%) |
| BURKES RUN | ANR Pipeline (TC Energy) | Lee, Iowa | 0.086 | +0.002 (+2.4%) | -0.000 (-0.0%) |
| PCS NITROGEN FERTILIZER | Panhandle Eastern Pipe Line | PAULDING, Ohio | 0.077 | +0.030 (+63.4%) | +0.005 (+11.2%) |
View full detail → 1346 tracked locations for gas day
| Meter / Interconnect | Pipeline | Location | Gas Day Bcf/d | Δ DoD | Δ 7d MA |
|---|---|---|---|---|---|
| West County MP 34.1 | Gulfstream Natural Gas System | 0.304 | -0.017 (-5.3%) | -0.007 (-2.1%) | |
| Athens | Iroquois Gas Transmission | 0.288 | -0.008 (-2.7%) | +0.009 (+3.2%) | |
| Lawrenceburg Power Plant | Texas Gas Transmission | 0.257 | +0.001 (+0.4%) | +0.004 (+1.6%) | |
| BBT BAMA/TGP BAMAGAS COLBERT | Tennessee Gas Pipeline (TGP) | 0.256 | +0.003 (+1.2%) | +0.008 (+3.4%) | |
| Dynegy Hanging Rock II, LLC | Texas Eastern Transmission (TETCO) | 0.233 | +0.004 (+1.8%) | +0.014 (+6.6%) | |
| FP&L Parrish Manatee MP 439.33 | Gulfstream Natural Gas System | 0.226 | +0.000 (+0.0%) | +0.008 (+4.1%) | |
| SMITH LOOPER BR M7416 MP 112.7 | Transco | 0.221 | +0.021 (+10.5%) | +0.000 (+0.0%) | |
| ZEELAND INTERCONNECT | ANR Pipeline (TC Energy) | 0.212 | +0.096 (+82.9%) | +0.017 (+15.6%) |
View full detail → 566 tracked locations for gas day
| Meter / Interconnect | Pipeline | Location | Gas Day Bcf/d | Δ DoD | Δ 7d MA |
|---|---|---|---|---|---|
| CVP STORAGE POINT (withdrawal, CPL) | CPL | Northeast | +0.819 | +0.000 (+0.0%) | +0.000 (+0.0%) |
| COVE POINT PLANT (injection, CPL) | CPL | Northeast | -0.749 | +0.000 (+0.0%) | +0.004 (+0.5%) |
| EGTS NET STORAGE ACTIVITY (injection, EGTS) | EGTS | Southeast | -0.584 | +0.113 (+16.2%) | +0.009 (+1.3%) |
| Monroe Gas Storage (injection, Texas Eastern Transmission (TETCO)) | Texas Eastern Transmission (TETCO) | Appalachia | -0.450 | -0.040 (-9.8%) | +0.001 (+0.2%) |
| Monroe Gas Storage (TGP interconnect) (withdrawal, Tennessee Gas Pipeline (TGP)) | Tennessee Gas Pipeline (TGP) | Northeast | +0.395 | -0.012 (-2.9%) | +0.004 (+1.0%) |
| Tx_Gas_SL (net injection/withdrawal, storage) | Pine Prairie Energy Center | Louisiana | -0.360 | +0.005 (+1.4%) | -0.002 (-0.6%) |
| Enstor Katy Storage (withdrawal, Gulf South Pipeline) | Gulf South Pipeline | Gulf Coast | +0.343 | +0.167 (+95.3%) | +0.007 (+2.2%) |
| EASTERN GAS - LEIDY STORAGE (D70931/R76931) (withdrawal, Texas Eastern Transmission (TETCO)) | Texas Eastern Transmission (TETCO) | Appalachia | -0.335 | -0.197 (-143.0%) | -0.037 (-36.3%) |
View full detail → 276 tracked locations for gas day
Get this data
- CSV / RSS feed — coming soon
- Embed / badge snippet & license terms — coming soon
- Pro real-time access →
Recent days
Data licensed CC BY 4.0. Reuse requires a live, followed link to this page. Figures are PipeScrape's own scraped totals from monitored interstate pipelines; comparison percentages are against the national supply/demand benchmark where available. Gas day October 27, 2026 reflects same-day (T0) data as of publish time 2026-10-27 05:15 local; figures may be revised as later nomination cycles post. Day-over-day compares each gas day at the same point in its posting cycle, so it is not the difference between the two dated columns — earlier days have since settled upward as later cycles posted.