
Posted Quantities, Not Estimates
Every figure on these pages is a posted scheduled quantity — the volume a pipeline published at a named meter, on a named cycle, added up. Not measured flow, not a model: what the pipeline posted. Nothing is scaled to a national total (LNG Canada, a labeled exception, is derived).
For a trader the question is rarely “what is U.S. power burn today?” It is “what changed since yesterday, where, and is it real?” Postings answer all three better than a scaled-up estimate: the figure is available as each cycle closes, at the point where the gas moved, with the filing to prove it. Our own tests showed that scaling our data up to match a national estimate produced a number no better than the estimate, published later — so we stopped.
We cover the interstate system, not the whole country. Texas intrastate pipelines, customers behind LDC citygates and the California utilities don’t post the same way, so those flows are not in our totals yet. We are adding additional meters and pipelines every week, each validated before it counts, so coverage keeps rising. What we won’t do is invent the rest.
| Category | Oct-20 | Oct-21 | Oct-22 | Oct-23 | Oct-24 | Δ DoDvs. same cycle | Δ 7d MA |
|---|---|---|---|---|---|---|---|
| Supply / Production 62.4% Sample | 67.198 | 67.901 | 68.360 | 69.184 | 67.797 | -0.625 (-0.9%) | +0.110 (+0.2%) |
| LNG Feedgas 100.0% Sample | 18.559 | 19.097 | 19.462 | 19.552 | 19.625 | +0.076 (+0.4%) | +0.018 (+0.1%) |
| Canada Import 100.0% Sample | 4.815 | 4.953 | 4.861 | 4.428 | 5.161 | +0.734 (+16.6%) | -0.010 (-0.2%) |
| Export to Mexico 17.3% Sample | 1.238 | 1.291 | 1.178 | 1.158 | 1.144 | -0.042 (-3.5%) | -0.011 (-0.9%) |
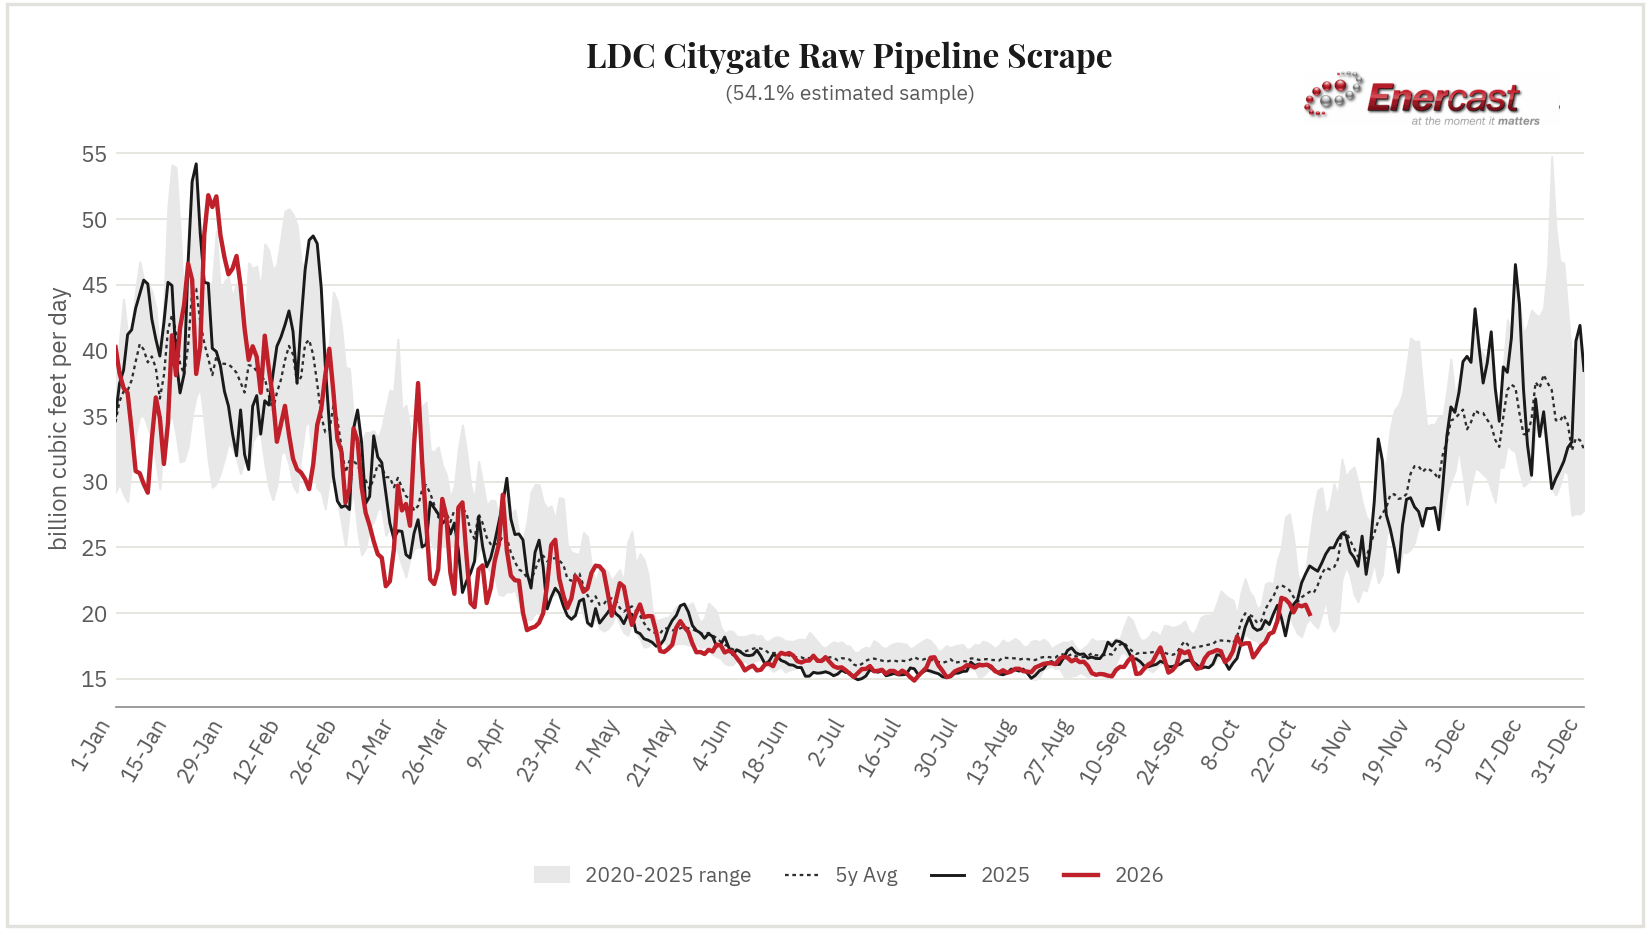
| LDC Citygate 54.1% Sample | 20.061 | 20.623 | 20.520 | 20.636 | 19.935 | -0.616 (-3.0%) | -0.176 (-0.9%) |
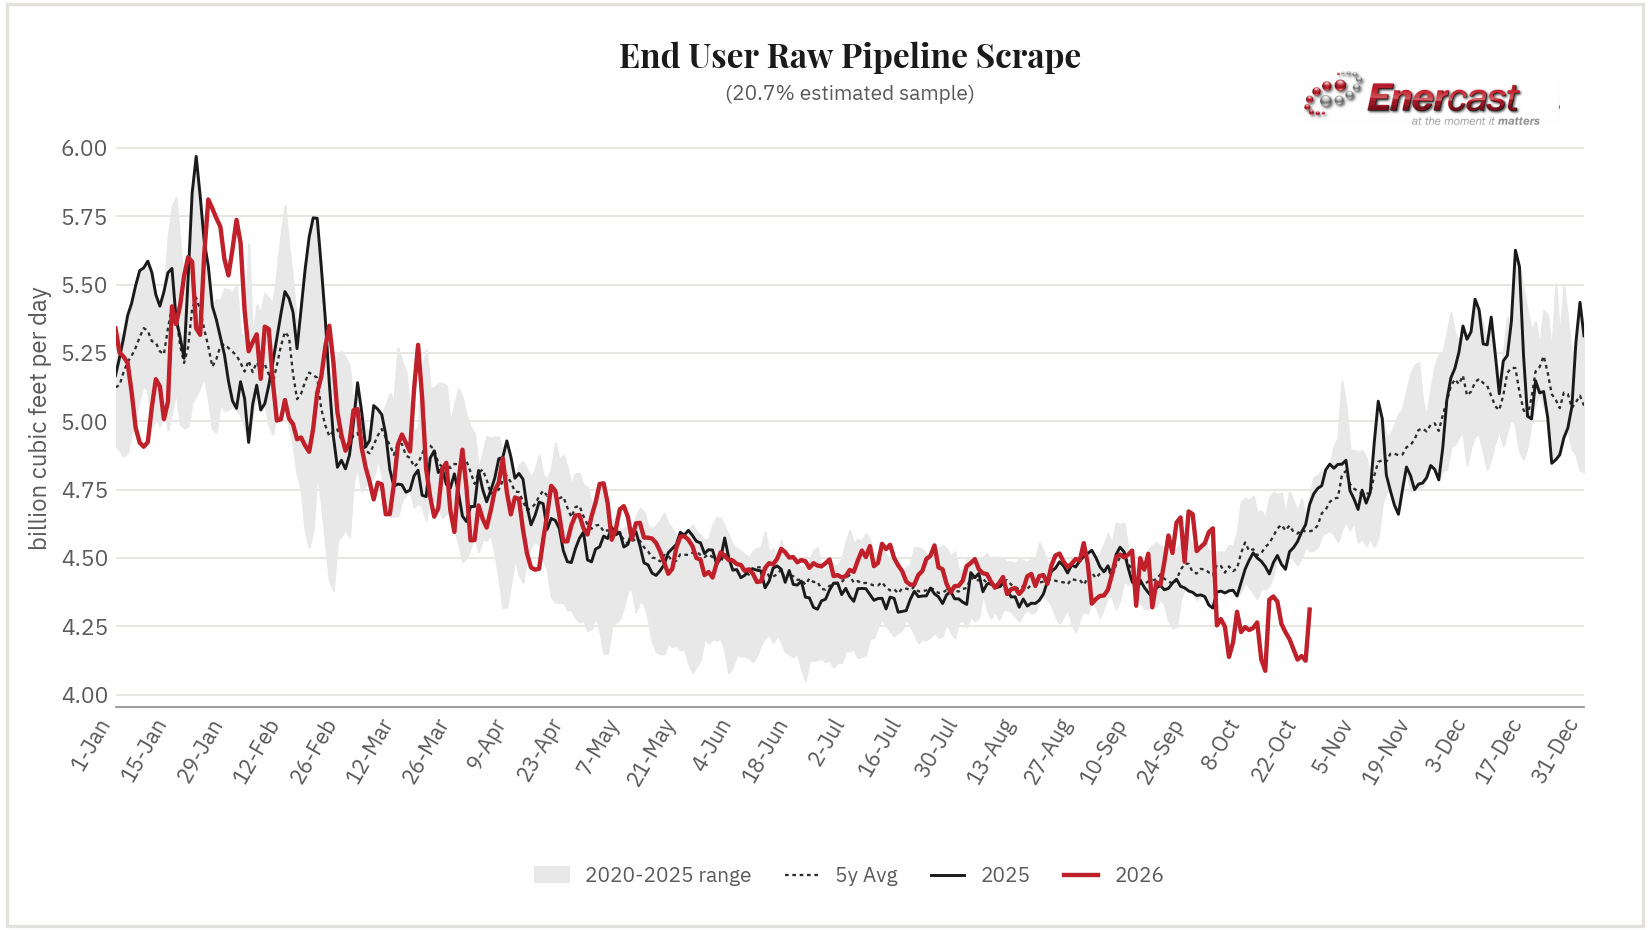
| End User 20.7% Sample | 4.166 | 4.128 | 4.141 | 4.124 | 4.311 | +0.056 (+1.3%) | +0.007 (+0.2%) |
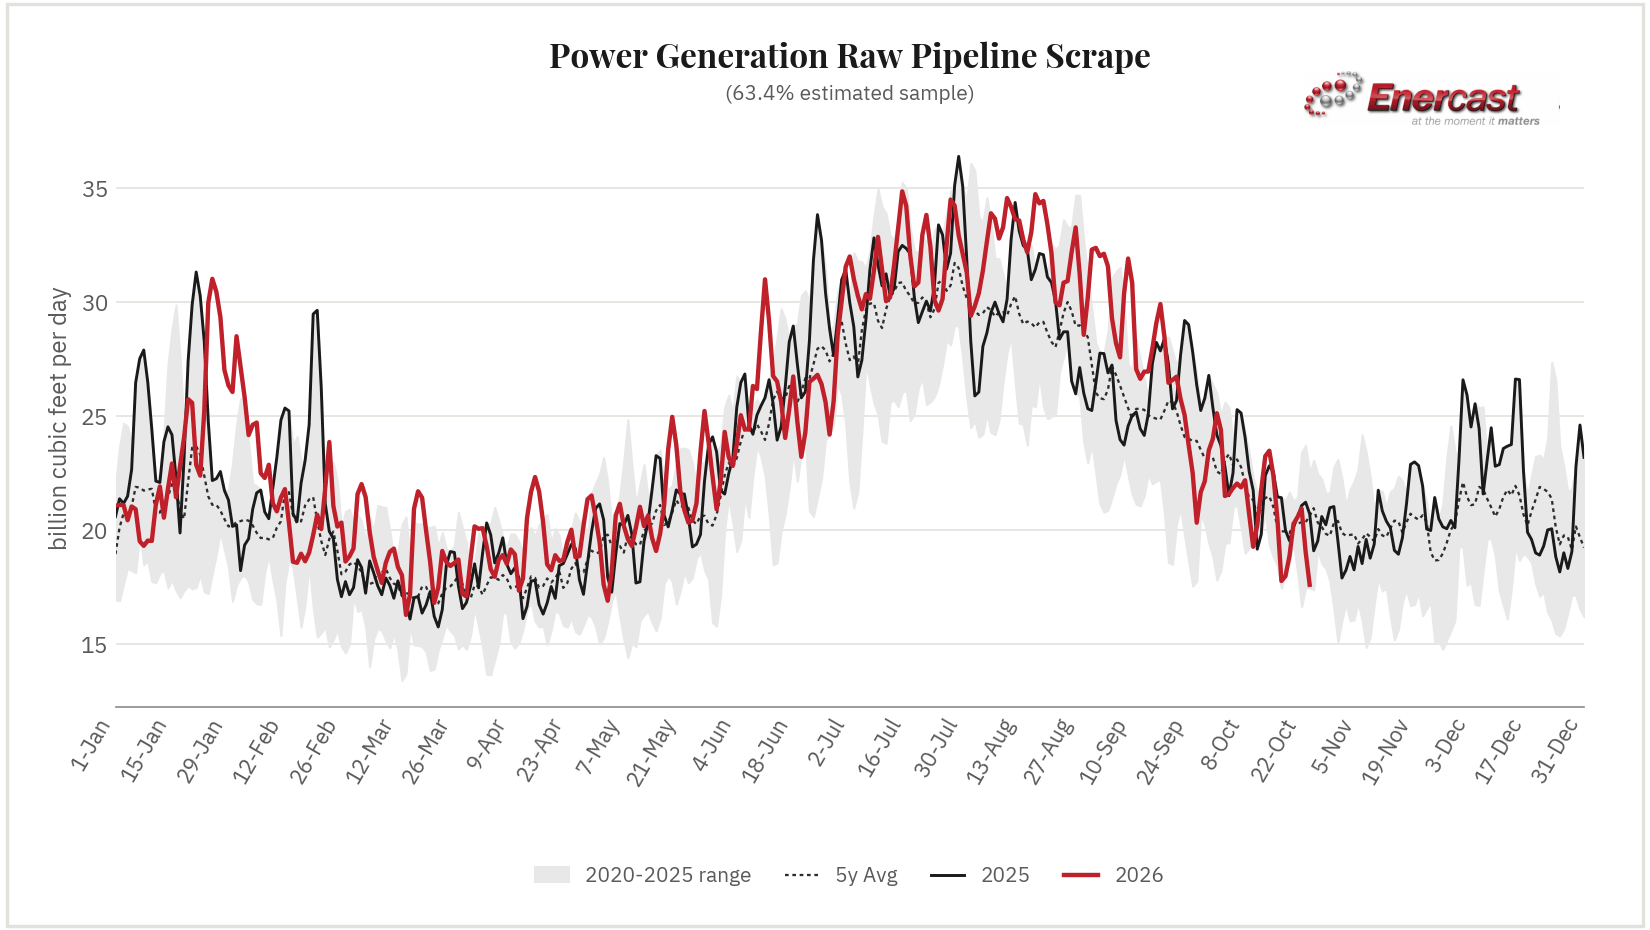
| Power Generation 63.4% Sample | 20.278 | 20.580 | 20.953 | 19.056 | 17.607 * | -1.593 (-8.3%) | -0.024 (-0.1%) |
| Storage Sample unknown | +5.885 | +4.982 | +5.943 | +7.273 | +6.849 * | +0.662 (+10.7%) | +0.146 (+2.4%) |
* Power Generation: Kern River Gas Transmission has not published updated data for today.
* Storage: UGI Storage has not published updated data for today.
Gas day October 24, 2026 is today's gas day — not yet fully settled, and subject to revision as later cycles post.
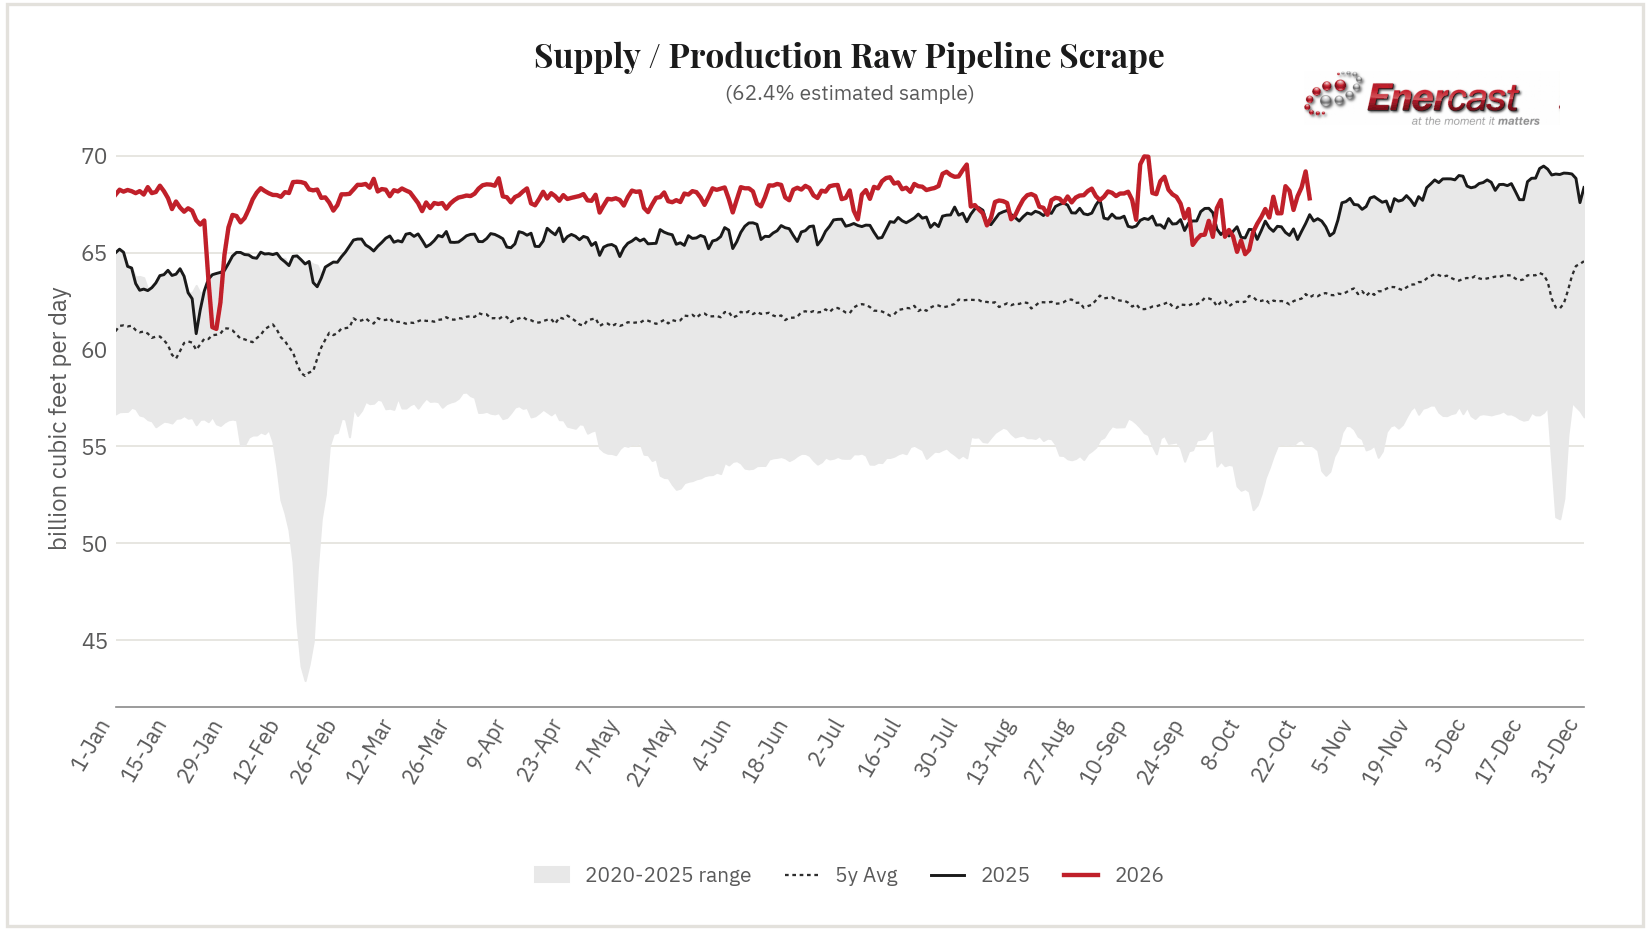
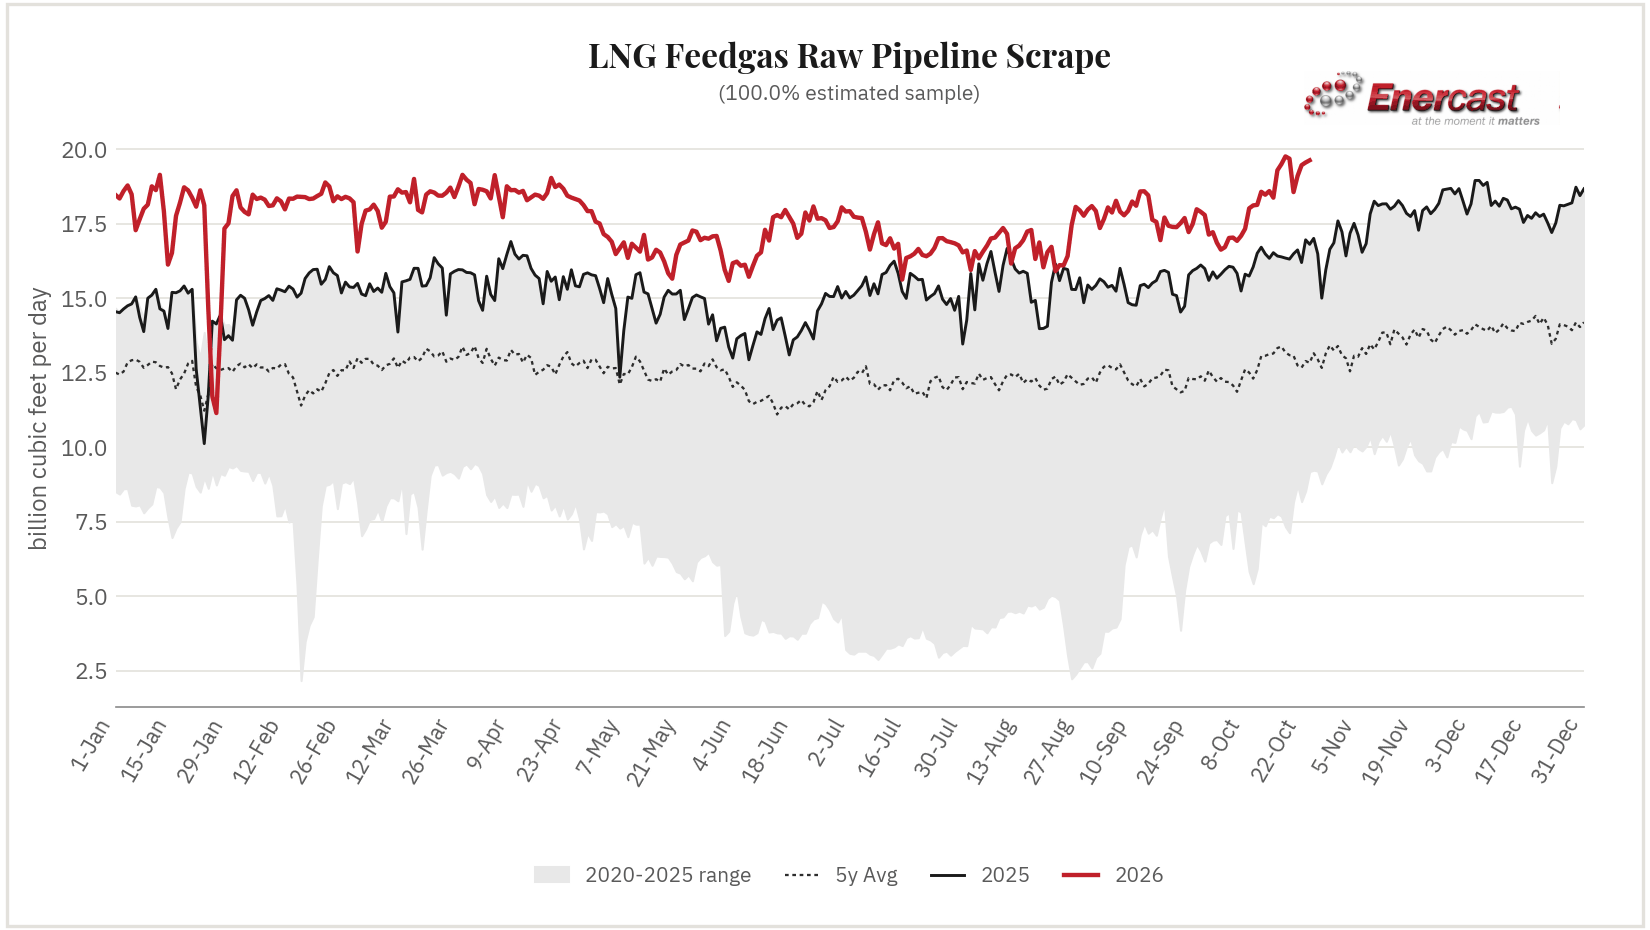
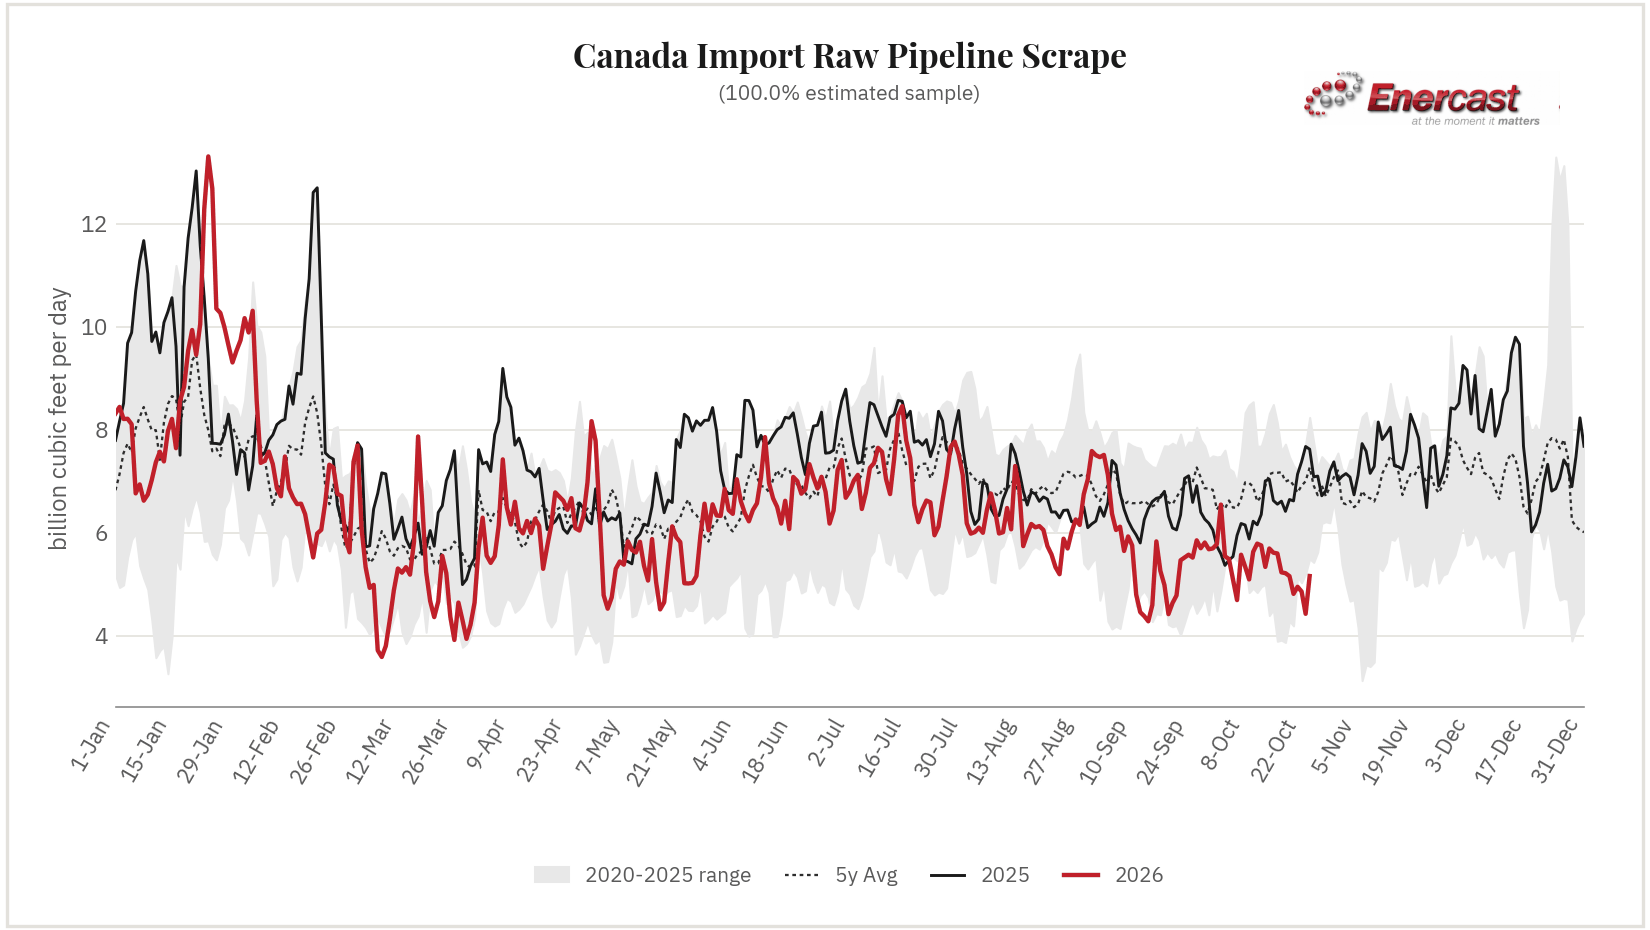
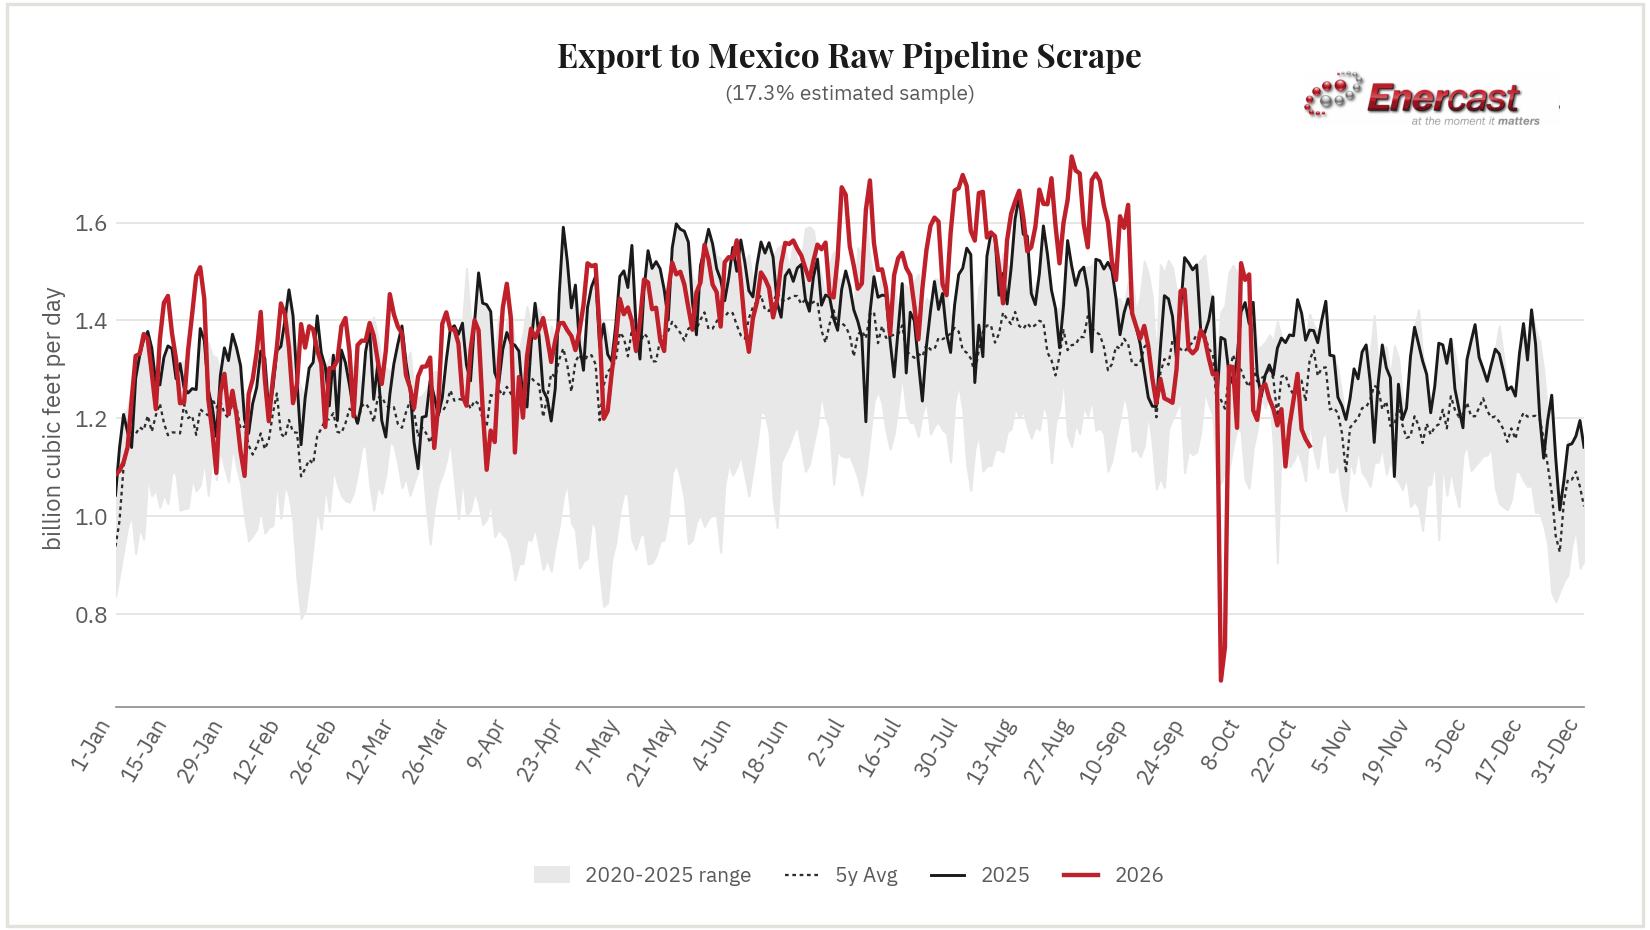
| Meter / Interconnect | Pipeline | Location | Gas Day Bcf/d | Δ DoD | Δ 7d MA |
|---|---|---|---|---|---|
| Pineville (receipt, intrastate_interconnect) | Texas Gas Transmission | Louisiana | 1.212 | +0.007 (+0.6%) | +0.001 (+0.1%) |
| ZICK M3659 MP 47.22 (receipt, gathering) | Transco | Pennsylvania | 1.087 | -0.019 (-1.7%) | -0.003 (-0.3%) |
| SHERWOOD (receipt, processing) | Rover Pipeline | West Virginia | 0.826 | -0.014 (-1.7%) | -0.002 (-0.2%) |
| APPLACHA/STAGEPS CHERRY RD SULLIVAN (receipt, gathering) | Stagecoach Pipeline and Storage | Pennsylvania | 0.818 | -0.006 (-0.7%) | -0.001 (-0.1%) |
| Sherwood - MXP (receipt, processing) | Columbia Gas Transmission (TCO) | West Virginia | 0.771 | -0.006 (-0.8%) | +0.110 (+18.5%) |
| BROADMORE RD. (receipt, intrastate_interconnect) | Columbia Gulf Transmission (CGT) | Louisiana | 0.750 | -0.019 (-2.5%) | -0.001 (-0.1%) |
| APPLACHA/TGP UDP LIBERTY DEHY: RIP (receipt, gathering) | Tennessee Gas Pipeline (TGP) | Pennsylvania | 0.732 | -0.170 (-18.8%) | -0.003 (-0.4%) |
| EQM GATHERING - BONNETHEAD (BI-DI D 74110/R 74111) (receipt, gathering) | Texas Eastern Transmission (TETCO) | Pennsylvania | 0.723 | -0.050 (-6.5%) | +0.006 (+0.9%) |
View full detail → 1751 tracked locations for gas day
| Meter / Interconnect | Pipeline | Location | Gas Day Bcf/d | Δ DoD | Δ 7d MA |
|---|---|---|---|---|---|
| Plaquemines -- Gator Express terminal delivery | Venture Global Gator Express | Gulf Coast | 4.353 | +0.014 (+0.3%) | +0.016 (+0.4%) |
| Corpus Christi (Cheniere) | Corpus Christi LNG | Gulf Coast | 2.666 | +0.069 (+2.7%) | -0.011 (-0.4%) |
| Calcasieu Pass -- TransCameron terminal delivery | TransCameron Pipeline | Gulf Coast | 1.618 | -0.008 (-0.5%) | -0.024 (-1.5%) |
| Cameron -- CIP terminal delivery | Cameron Interstate Pipeline | Gulf Coast | 1.531 | -0.029 (-1.9%) | -0.004 (-0.3%) |
| Sabine Pass -- Creole Trail leg | Sabine Pass LNG | Gulf Coast | 1.499 | -0.025 (-1.6%) | -0.009 (-0.6%) |
| Sabine -- KMLP terminal delivery | Kinder Morgan Louisiana Pipeline | Gulf Coast | 1.498 | -0.012 (-0.8%) | -0.004 (-0.3%) |
| Freeport -- Gulf South Stratton Ridge leg | Gulf South Pipeline | Gulf Coast | 1.441 | +0.011 (+0.8%) | +0.047 (+3.6%) |
| Sabine Pass -- Transco Lighthouse Road delivery | Transco | Gulf Coast | 1.152 | -0.047 (-3.9%) | -0.007 (-0.6%) |
View full detail → 15 tracked locations for gas day
| Meter / Interconnect | Pipeline | Location | Gas Day Bcf/d | Δ DoD | Δ 7d MA |
|---|---|---|---|---|---|
| GTN Kingsgate | Gas Transmission Northwest | Pacific Northwest | 2.946 | +0.610 (+26.1%) | +0.042 (+1.7%) |
| Alliance Border USA -- import from Canada (Sherwood, ND) | Alliance Pipeline | Midwest | 1.822 | +0.000 (+0.0%) | +0.010 (+0.6%) |
| Great Lakes Emerson (receipt) | Great Lakes Gas Transmission | Upper Midwest | 1.135 | -0.000 (-0.0%) | +0.000 (+0.0%) |
| Northwest Sumas (receipt) | Northwest Pipeline | Pacific Northwest | 0.858 | +0.023 (+2.8%) | +0.010 (+1.2%) |
| Vector St. Clair (US) -- export to Dawn, Ontario | Vector Pipeline | Midwest | -0.714 | +0.083 (+10.4%) | -0.058 (-12.5%) |
| Great Lakes St Clair (delivery to Ontario) | Great Lakes Gas Transmission | Upper Midwest | -0.610 | +0.066 (+9.8%) | -0.012 (-2.1%) |
| TGP Niagara (TRANSCAN UDP, delivery to TransCanada) | Tennessee Gas Pipeline (TGP) | Northeast | -0.579 | +0.010 (+1.7%) | +0.004 (+0.7%) |
| Viking Emerson -- import from Canada (Kittson County, MN; TC Mainline delivery to Viking, alongside Great Lakes Emerson 33975) | Viking Gas Transmission | Upper Midwest | 0.515 | +0.009 (+1.8%) | +0.001 (+0.2%) |
View full detail → 16 tracked locations for gas day
| Meter / Interconnect | Pipeline | Location | Gas Day Bcf/d | Δ DoD | Δ 7d MA |
|---|---|---|---|---|---|
| North Baja -- Ogilby (border crossing to Baja California) | North Baja Pipeline | Southwest | 0.495 | +0.014 (+2.9%) | +0.004 (+0.8%) |
| TGP -- Rio Bravo (Hidalgo Co. crossing) | Tennessee Gas Pipeline (TGP) | South Texas | 0.222 | -0.023 (-9.4%) | -0.008 (-3.2%) |
| TGP -- CENAGAS/PEMEX south delivery | Tennessee Gas Pipeline (TGP) | South Texas | 0.163 | -0.010 (-5.8%) | -0.004 (-2.4%) |
| EPNG -- El Fresnal (CFE) | El Paso Natural Gas (EPNG) | Southwest | 0.113 | +0.001 (+0.9%) | -0.001 (-0.9%) |
| EPNG -- Mexicana de Cobre (Douglas AZ) | El Paso Natural Gas (EPNG) | Southwest | 0.074 | +0.000 (+0.0%) | -0.004 (-4.4%) |
| GASDEAGU/SIERRITA SASABE PIMA (delivery, mexico_border) | Sierrita Gas Pipeline (SGP) | Arizona | 0.043 | +0.005 (+12.9%) | +0.001 (+2.4%) |
| EPNG -- Willmex (CENAGAS, Cochise) | El Paso Natural Gas (EPNG) | Southwest | 0.035 | +0.000 (+0.0%) | +0.000 (+0.0%) |
| TGP -- Valley Crossing allocation | Tennessee Gas Pipeline (TGP) | South Texas | 0.000 | +0.000 | +0.000 |
View full detail → 8 tracked locations for gas day
| Meter / Interconnect | Pipeline | Location | Gas Day Bcf/d | Δ DoD | Δ 7d MA |
|---|---|---|---|---|---|
| NICORGAS/NGPL CDP | Natural Gas Pipeline (NGPL) | WILL, Illinois | 0.901 | -0.014 (-1.5%) | -0.013 (-1.3%) |
| NEW YORK FAC GROUP MP 1829.08 | Transco | Richmond, New York | 0.693 | -0.039 (-5.3%) | -0.006 (-0.8%) |
| PUBLIC SERVICE E&G MP 1809.25 | Transco | Essex, New Jersey | 0.463 | -0.105 (-18.5%) | -0.000 (-0.0%) |
| SOCETS/MPC (KRAMER) KRAMER JCT DEL | Mojave Pipeline (MOPC) | 0.399 | -0.041 (-9.3%) | +0.006 (+1.5%) | |
| NIPSCO/NGPL CDP | Natural Gas Pipeline (NGPL) | COOK, Illinois | 0.383 | -0.105 (-21.5%) | -0.007 (-1.6%) |
| SOCETS/MPC (SOCWR) WHEELER RIDGE | Mojave Pipeline (MOPC) | 0.331 | -0.068 (-17.0%) | +0.000 (+0.0%) | |
| WISCONSIN | ANR Pipeline (TC Energy) | WOOD, Wisconsin | 0.282 | -0.047 (-14.3%) | +0.003 (+0.9%) |
| WASATCH FRONT DEL | MountainWest Pipelines | CACHE, Utah | 0.251 | +0.006 (+2.4%) | +0.006 (+2.8%) |
View full detail → 4057 tracked locations for gas day
| Meter / Interconnect | Pipeline | Location | Gas Day Bcf/d | Δ DoD | Δ 7d MA |
|---|---|---|---|---|---|
| Methanex Geismer 2 | Gulf South Pipeline | 0.198 | +0.007 (+3.7%) | +0.004 (+2.3%) | |
| Port Arthur-Motiva | Florida Gas Transmission | JEFFERSON, Texas | 0.133 | +0.003 (+2.3%) | +0.006 (+6.4%) |
| FHR PINE BEND ROSEMOUNT MN COMPLEX | Northern Natural Gas | DAKOTA, Minnesota | 0.104 | +0.010 (+10.6%) | +0.001 (+1.1%) |
| CF INDUSTRIES PORT NEAL 2 | Northern Natural Gas | WOODBURY, Iowa | 0.096 | -0.001 (-1.0%) | -0.000 (-0.0%) |
| WRB REFINING LP | Enable Mississippi River Transmission (MRT) | MADISON, Illinois | 0.096 | +0.002 (+2.1%) | -0.002 (-1.9%) |
| TOSCO REFINERY M6304 MP 20.7 | Transco | DELAWARE, Pennsylvania | 0.086 | +0.037 (+75.5%) | +0.010 (+37.7%) |
| BURKES RUN | ANR Pipeline (TC Energy) | Lee, Iowa | 0.086 | +0.001 (+1.2%) | -0.000 (-0.0%) |
| Pascagoula High Pressure (To Chevron) | Gulf South Pipeline | Jackson, Mississippi | 0.076 | +0.004 (+5.6%) | +0.001 (+1.4%) |
View full detail → 1346 tracked locations for gas day
| Meter / Interconnect | Pipeline | Location | Gas Day Bcf/d | Δ DoD | Δ 7d MA |
|---|---|---|---|---|---|
| Athens | Iroquois Gas Transmission | 0.296 | +0.007 (+2.4%) | +0.008 (+3.1%) | |
| SO CO/SNG PLANT MCDONOUGH COBB (Georgia Power Co) | Southern Natural Gas | Fulton County (WRI geocode; meter says Cobb -- see note), GA | 0.251 | -0.029 (-10.3%) | -0.001 (-0.3%) |
| West County MP 34.1 | Gulfstream Natural Gas System | 0.247 | -0.148 (-37.5%) | -0.021 (-5.5%) | |
| Lawrenceburg Power Plant | Texas Gas Transmission | 0.243 | -0.000 (-0.0%) | -0.007 (-2.7%) | |
| BBT BAMA/TGP BAMAGAS COLBERT | Tennessee Gas Pipeline (TGP) | 0.233 | +0.005 (+2.2%) | +0.020 (+10.8%) | |
| FP&L Parrish Manatee MP 439.33 | Gulfstream Natural Gas System | 0.226 | +0.054 (+31.4%) | -0.006 (-3.2%) | |
| Dynegy Hanging Rock II, LLC | Texas Eastern Transmission (TETCO) | 0.215 | -0.018 (-7.7%) | +0.031 (+26.0%) | |
| SMITH LOOPER BR M7416 MP 112.7 | Transco | 0.209 | -0.014 (-6.3%) | -0.005 (-2.3%) |
View full detail → 558 tracked locations for gas day
| Meter / Interconnect | Pipeline | Location | Gas Day Bcf/d | Δ DoD | Δ 7d MA |
|---|---|---|---|---|---|
| CVP STORAGE POINT (withdrawal, CPL) | CPL | Northeast | +0.819 | +0.000 (+0.0%) | +0.000 (+0.0%) |
| COVE POINT PLANT (injection, CPL) | CPL | Northeast | -0.774 | +0.000 (+0.0%) | -0.001 (-0.1%) |
| EGTS NET STORAGE ACTIVITY (injection, EGTS) | EGTS | Southeast | -0.656 | +0.025 (+3.7%) | -0.015 (-2.4%) |
| SYSTEM AREA STORAGE INJECTIONS (injection, Northern Natural Gas) | Northern Natural Gas | Midwest | -0.489 | -0.009 (-1.9%) | -0.012 (-3.0%) |
| Monroe Gas Storage (injection, Texas Eastern Transmission (TETCO)) | Texas Eastern Transmission (TETCO) | Appalachia | -0.415 | +0.042 (+9.2%) | +0.002 (+0.4%) |
| Monroe Gas Storage (TGP interconnect) (withdrawal, Tennessee Gas Pipeline (TGP)) | Tennessee Gas Pipeline (TGP) | Northeast | +0.412 | +0.037 (+9.8%) | +0.011 (+3.1%) |
| Enstor Katy Storage (withdrawal, Gulf South Pipeline) | Gulf South Pipeline | Gulf Coast | +0.352 | +0.022 (+6.7%) | +0.003 (+0.9%) |
| Tx_Gas_SL (net injection/withdrawal, storage) | Pine Prairie Energy Center | Louisiana | -0.342 | +0.015 (+4.2%) | +0.000 (+0.0%) |
View full detail → 276 tracked locations for gas day
Get this data
- CSV / RSS feed — coming soon
- Embed / badge snippet & license terms — coming soon
- Pro real-time access →
Recent days
Data licensed CC BY 4.0. Reuse requires a live, followed link to this page. Figures are PipeScrape's own scraped totals from monitored interstate pipelines; comparison percentages are against the national supply/demand benchmark where available. Gas day October 24, 2026 reflects same-day (T0) data as of publish time 2026-10-24 05:15 local; figures may be revised as later nomination cycles post. Day-over-day compares each gas day at the same point in its posting cycle, so it is not the difference between the two dated columns — earlier days have since settled upward as later cycles posted.