
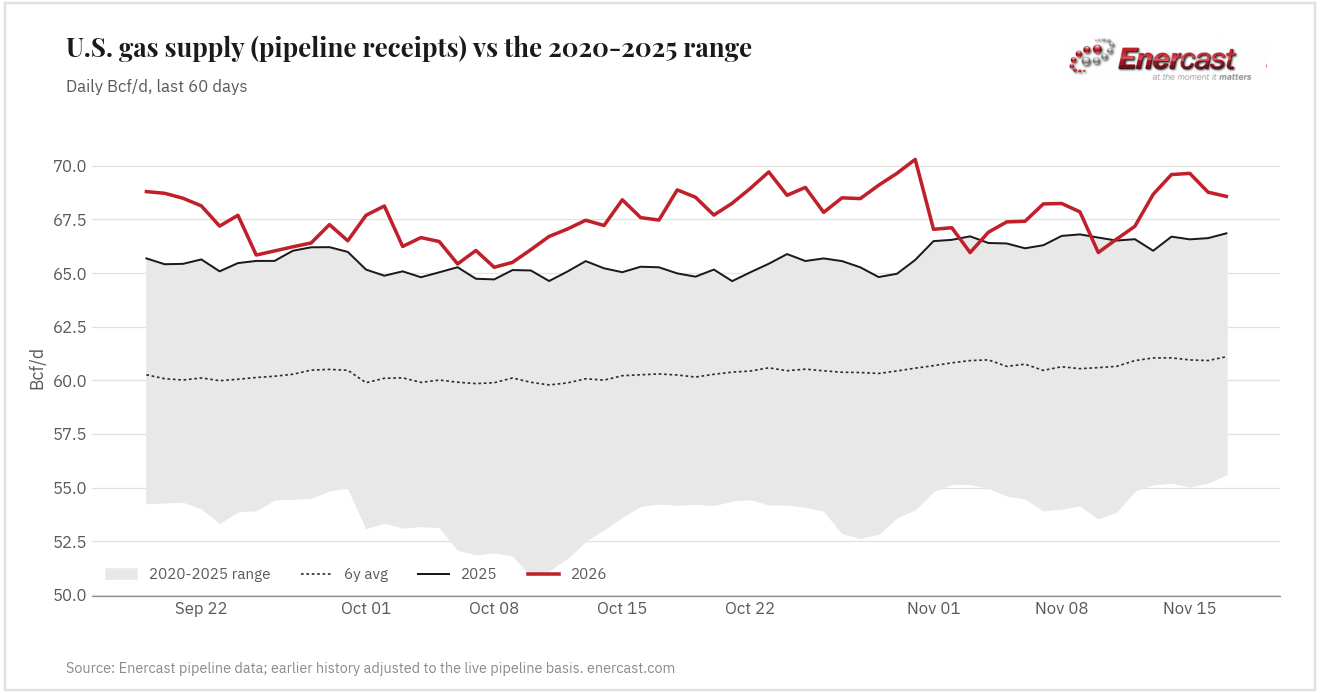
U.S. natural gas supply has come back. Pipeline receipts in Enercast’s data averaged 69.14 Bcf/d over November 14–17, up 2.39 Bcf/d from the 66.75 Bcf/d of November 1–4, and reached 69.64 Bcf/d on November 15, the highest November day in Enercast’s data back to 2020. That recovers almost all of the drop we reported at the start of the month.
Supply is also running about 2.5 Bcf/d (4%) above the same days of 2025. As before, these are actual pipeline nomination figures: scheduled quantities at the receipt points where gas enters interstate pipelines, covering an estimated 60% or so of U.S. dry gas production.
The same two basins, in reverse
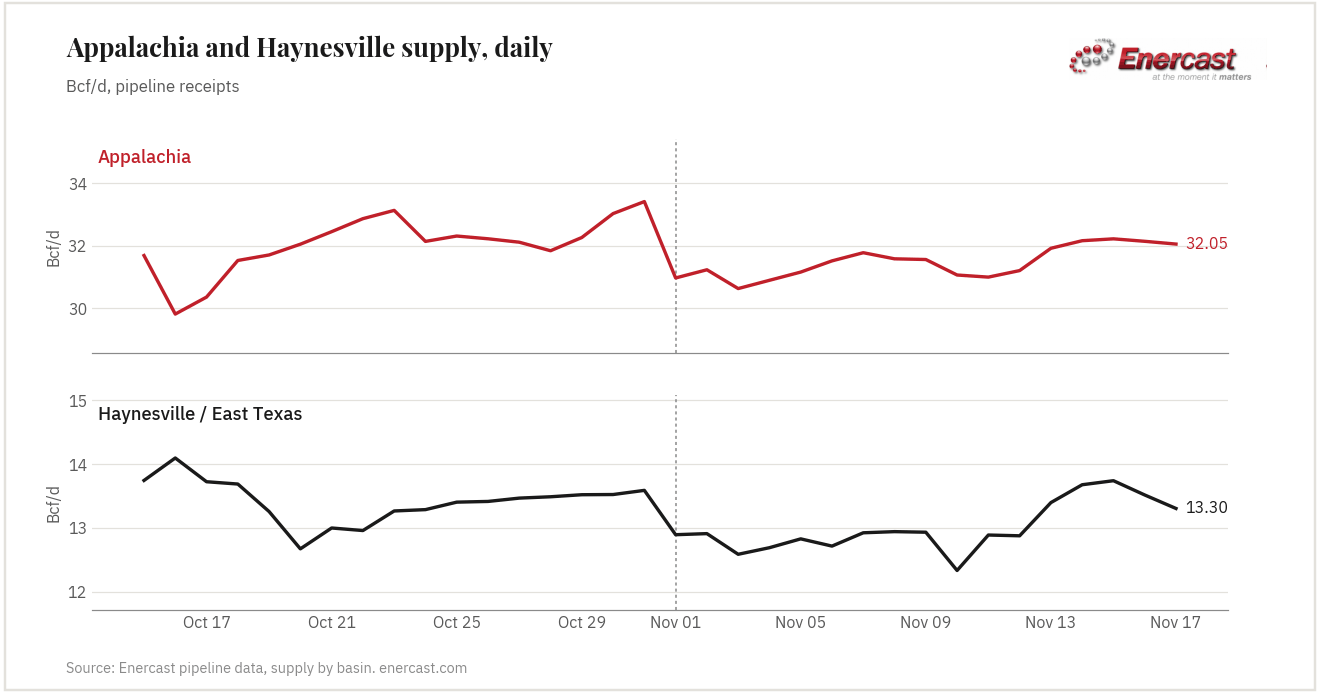
The rebound came from where the drop came from. Appalachia rose 1.22 Bcf/d, from 30.93 to 32.14 Bcf/d, and Haynesville / East Texas rose 0.79, from 12.77 to 13.56. Together they account for 2.0 of the 2.4 Bcf/d recovery. Appalachia is still about 0.5 Bcf/d below its late-October level; Haynesville is back to where it was.
| Basin | Nov 1–4 | Nov 14–17 | Change |
|---|---|---|---|
| Appalachia | 30.93 | 32.14 | +1.22 |
| Haynesville / East Texas | 12.77 | 13.56 | +0.79 |
| Appalachia fringe | 0.78 | 1.05 | +0.26 |
| Midcontinent | 2.68 | 2.88 | +0.20 |
| Eagle Ford / Gulf Coast | 2.84 | 3.01 | +0.17 |
| Gulf of Mexico offshore | 1.22 | 1.35 | +0.13 |
| Permian via long-hauls | 2.16 | 2.27 | +0.12 |
| Bakken | 1.35 | 1.41 | +0.05 |
| Fayetteville | 0.68 | 0.65 | −0.03 |
| Rockies | 4.52 | 4.49 | −0.03 |
| North Texas | 1.17 | 1.08 | −0.09 |
| San Juan | 1.89 | 1.80 | −0.09 |
| Permian (direct) | 4.96 | 4.72 | −0.24 |
| Other / non-basin | −1.20 | −1.27 | −0.07 |
| U.S. total (pipeline receipts) | 66.75 | 69.14 | +2.39 |
Coverage differs by basin (about 85% of Appalachia, 80% of the Haynesville, 20% of the Permian). “Other / non-basin” is net interconnect flow, which is why it is negative.
The pipes are back too
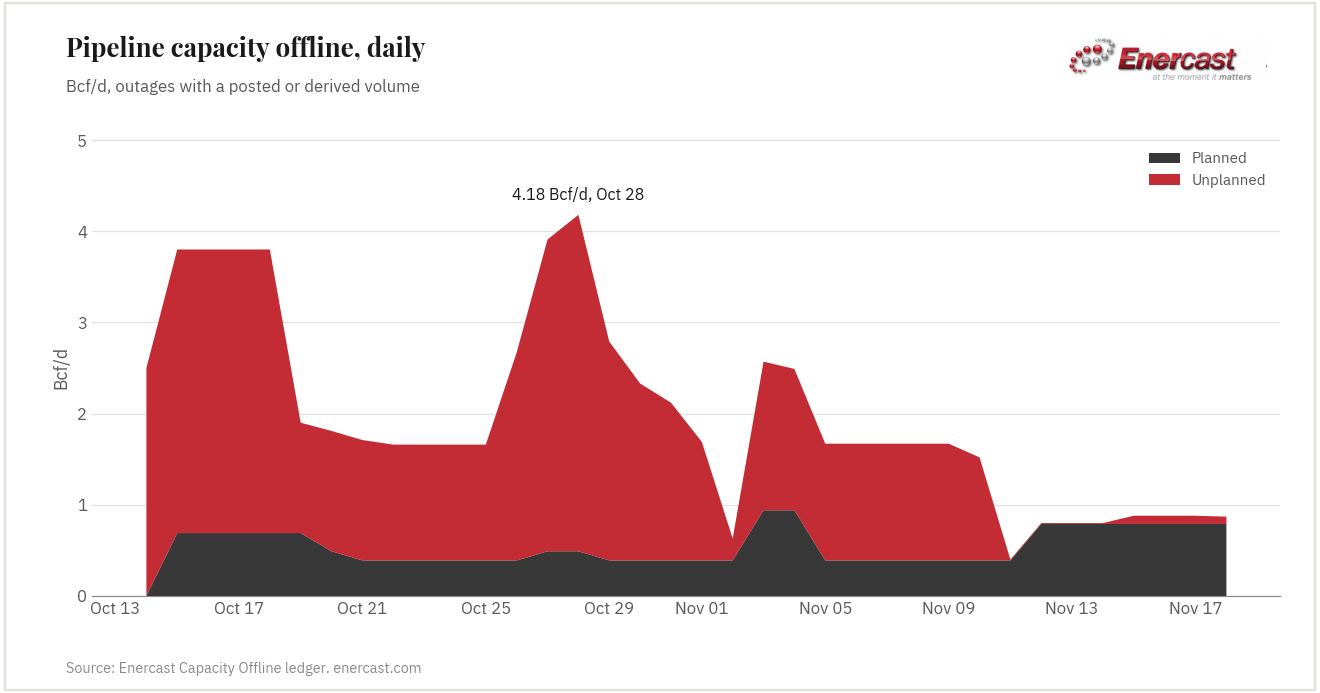
Supply is returning to a pipeline network with little work left on it. On Enercast’s Capacity Offline page, capacity offline with a posted or derived volume peaked at 4.18 Bcf/d on October 28. On November 18 it was about 0.9 Bcf/d, most of it two planned compressor outages that end within days: Sabine Pass’s Gillis compressor station (0.40 Bcf/d, through November 19) and Columbia Gulf’s Hampshire station (0.39 Bcf/d, through November 25).
The maintenance calendar ahead is nearly empty. Planned maintenance starts in Enercast’s notice archive fell from a summer peak of 19 in August to 6 in October and 3 so far in November. Only three new planned jobs are posted for December, none with a stated volume: compressor work at Mountain Valley Pipeline’s Harris and Stallworth stations (December 1–2 through February 27) and a one-day outage at Trunkline’s Kountze station (December 8–9).
| Pipeline | Location | Dates | Bcf/d |
|---|---|---|---|
| Sabine Pass | Gillis compressor station | through Nov 19 | 0.40 |
| Columbia Gulf | Hampshire compressor station | through Nov 25 | 0.39 |
| ANR | Southwest Mainline northbound | through Dec 18 | not stated |
| Mountain Valley | Harris compressor station | Dec 1 – Feb 27 | not stated |
| Mountain Valley | Stallworth compressor station | Dec 2 – Feb 27 | not stated |
| Trunkline | Kountze compressor station | Dec 8–9 | not stated |
Unplanned events have not stopped. Gas Transmission Northwest’s Kingsgate force majeure runs to November 27, and NGPL and Tennessee Gas Pipeline both declared new force majeures in the past week. None posted a volume large enough to move the national supply figure.
New pipe for this winter
This winter also starts with more pipe than last. Enercast’s New Capacity tracker counts 9.2 Bcf/d of stated capacity across 10 projects placed in service in the last 12 months, with three more partly in service. Most of it moves Permian gas to the Gulf Coast or feeds LNG terminals: WhiteWater’s 2.5 Bcf/d Blackcomb Pipeline, the 2.5 Bcf/d Golden Pass bidirectional line and Kinder Morgan’s Gulf Coast Express expansion. One links straight to this story: TC Energy placed its 1.4 Bcf/d Gillis Access extension in service on November 1, connecting Haynesville supply to the Gillis hub that feeds the Louisiana LNG terminals. Two serve Southeast power demand directly: Tennessee Gas Pipeline’s Cumberland project and East Tennessee’s Ridgeline expansion, which entered service this month.
| Project | Sponsor | State | Bcf/d | Serves |
|---|---|---|---|---|
| Blackcomb Pipeline | WhiteWater | TX | 2.50 | Permian to Gulf Coast |
| Golden Pass bidirectional pipeline | Golden Pass Pipeline | LA, TX | 2.50 | LNG |
| Gillis Access extension | TC Energy | LA | 1.40 | LNG |
| Gator Express uprate | Venture Global | LA | 0.63 | LNG |
| Gulf Coast Express expansion | Kinder Morgan | TX | 0.57 | Permian to Gulf Coast |
| Texas-Louisiana Expansion | NGPL | TX, LA | 0.47 | Power / LNG |
| Westbound Compression Expansion | Williams (MountainWest) | WY | 0.33 | Rockies |
| Bison Xpress (reversal) | Northern Border | ND, MT, WY | 0.30 | Bakken / Rockies |
| Ridgeline Expansion | East Tennessee | TN | 0.30 | Power |
| Cumberland Project | Tennessee Gas Pipeline | TN | 0.25 | Power |
| Total, 10 projects | 9.23 |
Bison Xpress reverses the direction of existing flow rather than adding new pipe; EIA lists it as −0.3 Bcf/d. Also partly in service: Hugh Brinson Pipeline (2.3 Bcf/d stated, TX), Louisiana Connector (2.0, LA/TX) and Gulf South’s PLUSS project (0.24, LA). Source: Enercast New Capacity tracker.
Two cautions. Stated capacity is what a project was built to carry, not what it flows. And new pipe adds deliverability, not production: it lets gas reach markets it could not reach before, which matters most in the Permian, where takeaway has limited output. The largest part of the recovery in this story came from Appalachia, which none of these projects serves.
What it means heading into winter
Supply is back near its October record, the maintenance season is over and there is more pipe in the ground than a year ago. The risks for the rest of the season are the ones nobody schedules: freeze-offs when the first hard cold reaches the producing basins, and the force majeures and compressor failures that, as we reported last week, did not slow down when planned work did.
How we count: Supply is the sum of scheduled receipts from gathering systems, processing plants and intrastate interconnects onto the interstate pipelines Enercast monitors, grouped by basin; coverage differs by basin. Year-ago comparisons use Enercast’s history series, adjusted to the same basis as the live pipeline data. The latest day is preliminary until the final nomination cycle. Capacity offline counts only outages with a posted or derived volume. New Capacity figures are sponsors’ stated design capacities.
Where this data comes from
The figures in this story come from three Enercast data sets: daily pipeline supply by basin, the Capacity Offline ledger built from pipeline notices, and the New Capacity project tracker. You can follow them yourself:
- Supply / Production — today’s total, the By Basin table, 6-day trend and seasonal chart
- Capacity Offline — today’s offline capacity, the outage calendar and map
- New Capacity — every U.S. pipeline project, its status and sources
- Daily Supply & Demand summary — all eight categories, free on the website daily by 7:30 AM ET
- How the numbers are built — posted quantities, not estimates
Sources: Enercast pipeline data and supply-by-basin breakdown · Enercast Capacity Offline ledger and critical-notice archive · Enercast New Capacity tracker (FERC filings, sponsor materials, EIA natural gas pipeline projects tracker). Not investment advice; see the disclaimer.
More from Pipeline News
- Which U.S. gas pipelines are actually getting built? A new Enercast tracker, sourced line by line · Nov 15, 2026
- Canada is sending less gas south as LNG Canada ramps up · Nov 12, 2026
- Pipeline maintenance season is over. Unplanned outages aren't. · Nov 10, 2026
- Video: how a pipeline notice becomes a trading alert · Nov 10, 2026