
Canada is sending less natural gas to the United States. Net pipeline imports from Canada averaged 5.66 Bcf/d from January through October, 0.83 Bcf/d (13%) less than the same months of 2025 and the lowest for that stretch since 2021 in Enercast’s pipeline data. Every month of 2026 so far has come in below the same month last year.
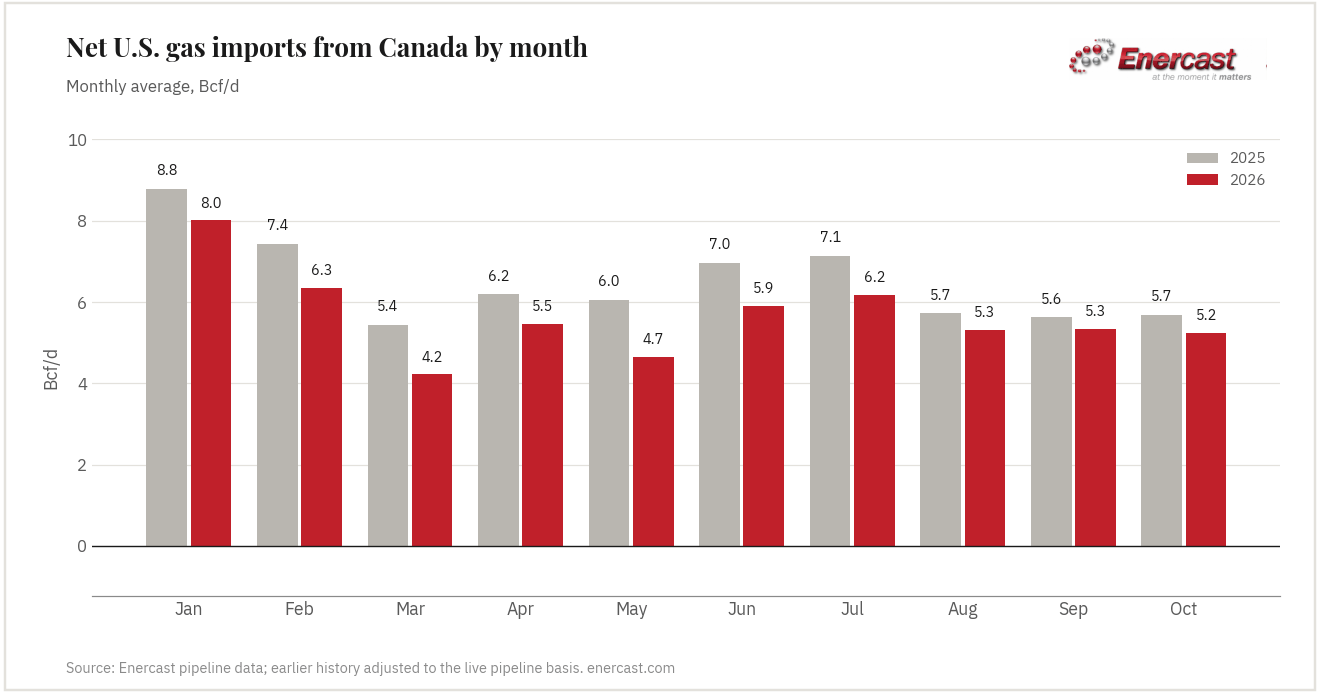
Over the same period a new buyer has been taking Western Canadian gas at home. LNG Canada, the Shell-led export terminal at Kitimat, British Columbia, began commercial operations in mid-2025 and brought its second train online in the fall of 2025. Enercast’s modelled estimate puts its feedgas at about 1.57 Bcf/d from January through October, up from roughly 0.2 Bcf/d a year earlier while the plant was still starting up.
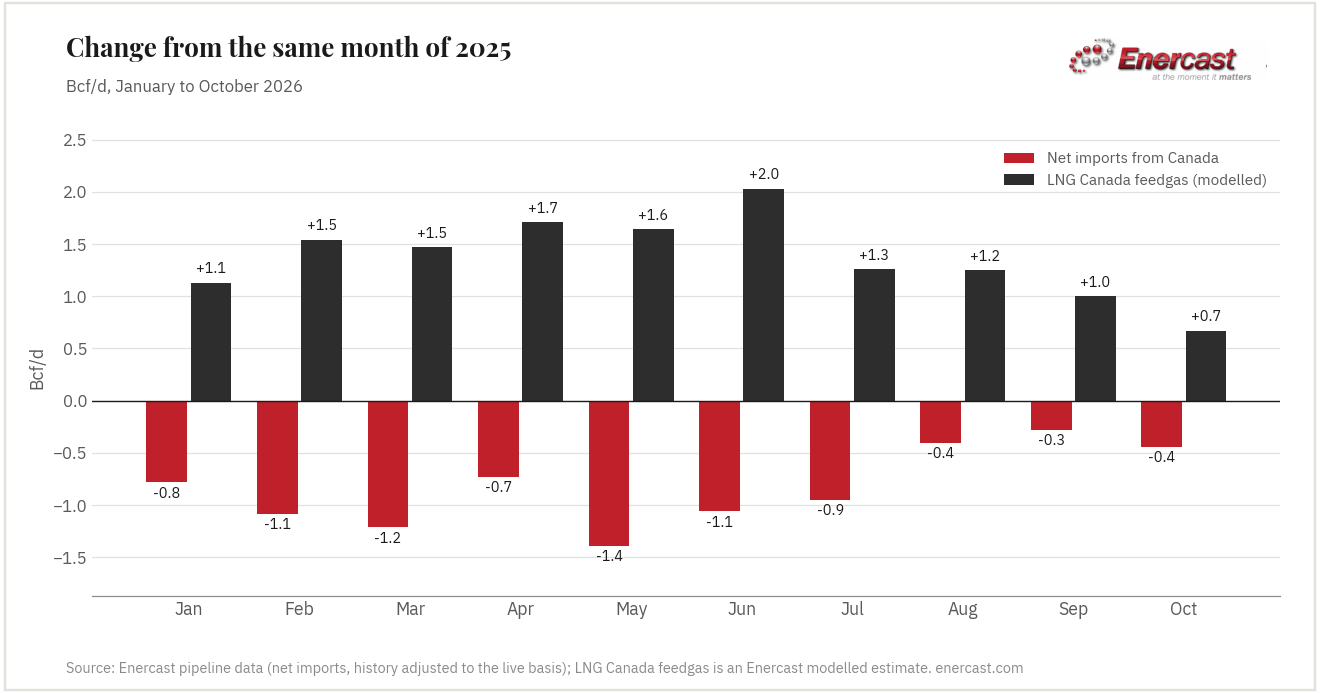
The two have moved in opposite directions all year. Through July, LNG Canada’s intake was up 1.1 to 2.0 Bcf/d on the year and imports were down 0.7 to 1.4 Bcf/d. From August the import shortfall narrowed to 0.3–0.4 Bcf/d, while the gain at Kitimat narrowed more gradually, to 0.7 Bcf/d by October, as last year’s start-up volumes rose. Canada’s own production, storage and demand also move the border flows, so the match is not one-for-one. But the U.S. Energy Information Administration made the same link in April, when it forecast that pipeline imports from Canada would decline through 2027 as new LNG capacity on Canada’s west coast ramps up.
October was the low point
Net imports averaged 5.25 Bcf/d in October, 0.44 Bcf/d (8%) below October 2025 and the lowest October since 2020. In the last ten days of the month they ran near 4.9 Bcf/d, with single days as low as 4.4.
Heating demand has since pulled them back up. Net imports averaged 6.05 Bcf/d over November 1–10 and reached 6.69 Bcf/d on November 11 (preliminary). The increase came mostly from the western border crossings: Northwest Pipeline at Sumas, Gas Transmission Northwest at Kingsgate and Great Lakes at Emerson.
| Pipeline | Crossing | October | Nov 1–10 | Change |
|---|---|---|---|---|
| Gas Transmission Northwest | Kingsgate, ID | 2.59 | 2.85 | +0.26 |
| Alliance | Sherwood, ND | 1.76 | 1.89 | +0.14 |
| Great Lakes | Emerson, MN | 1.06 | 1.28 | +0.22 |
| Northwest Pipeline | Sumas, WA | 0.82 | 1.14 | +0.32 |
| Viking | Emerson, MN | 0.48 | 0.44 | −0.04 |
| Northern Border | Port of Morgan, MT | 0.24 | 0.21 | −0.02 |
| Iroquois | Waddington, NY | 0.13 | 0.22 | +0.09 |
| Vector, NEXUS, Tennessee, Empire, Panhandle | Exports to Eastern Canada | −1.83 | −1.99 | −0.16 |
| Total net imports | 5.25 | 6.05 | +0.80 |
GTN’s increase came while Kingsgate was running under a force majeure. GTN declared it on October 29 after an equipment failure at its Wallula compressor station, reducing capacity for flow past Kingsgate. Receipts from Canada at the border still rose, to an average 2.85 Bcf/d in early November. The notice is still in effect, and it is the one to watch as winter demand builds on the West Coast.
| Gas days | What the notices said |
|---|---|
| Oct 29–Nov 8 | Gas Transmission Northwest: Gas Transmission Northwest has declared a Force Majeure due to an unexpected equipment failure at Wallula Compressor Station Unit A, impacting capacity at Flow Past Kingsgate (LOC #3500). FORCE MAJEURE EVENT: GTN – Flow Past Kingsgate (Posted: 10/29/26) (Oct 29) |
Notices selected from Enercast’s archive for the dates in this story. Every notice is in the Critical Notices archive.
What comes next
More Canadian gas is spoken for. LNG Canada’s partners took a final investment decision on a Phase 2 expansion on September 29 that would double the plant from 14 to 28 million tonnes a year, with operations expected early next decade. Until then, Kitimat’s intake should stay near its current level, so the year-on-year comparison gets easier from here and the gap in imports may keep narrowing. The level has still reset lower: around 1.5 Bcf/d of Western Canadian gas now goes to Kitimat that two years ago had no export outlet on Canada’s coast.
How we count: Enercast’s Canada figure is net imports: gas scheduled into the U.S. at the border meters on the western and Midwest crossings, minus gas scheduled out to Eastern Canada through Vector, NEXUS, Tennessee, Empire and Panhandle. It reads lower than gross import figures such as EIA’s for that reason. Comparisons with earlier years use Enercast’s history series, adjusted to the same basis as the live pipeline data. LNG Canada feedgas is a modelled estimate, not a measured flow.
Where this data comes from
The figures in this story come from Enercast’s daily pipeline data, built from the scheduled quantities U.S. pipelines post at each border meter. You can follow them yourself:
- Canada Imports — today’s net imports, 6-day trend, seasonal chart and the border meters
- LNG Canada feedgas — the modelled daily estimate
- Gas Transmission Northwest notices — the Kingsgate force majeure and updates
- Daily Supply & Demand summary — all eight categories, free on the website daily by 7:30 AM ET
- How the numbers are built — posted quantities, not estimates
Sources: Enercast pipeline data (border meter nominations, interstate pipeline bulletin boards) · Enercast critical-notice archive · U.S. EIA, Today in Energy, April 16, 2026 · LNG Canada Phase 2 final investment decision, September 29, 2026. Not investment advice; see the disclaimer.
More from Pipeline News
- Pipeline maintenance season is over. Unplanned outages aren't. · Nov 10, 2026
- Video: how a pipeline notice becomes a trading alert · Nov 10, 2026
- New on Enercast: daily U.S. gas supply by basin · Nov 9, 2026
- U.S. gas supply drops 2.6 Bcf/d into November as Appalachia and Haynesville pull back · Nov 5, 2026