
The summer pipeline maintenance season is over. Enercast’s notice archive counted 18 planned maintenance outages starting in August across U.S. interstate pipelines; by October that was down to 5, and only one has started so far in November. Unplanned outages — force majeures, compressor failures and capacity constraints — did not follow: October had 28, matching September as the most of any month since June.
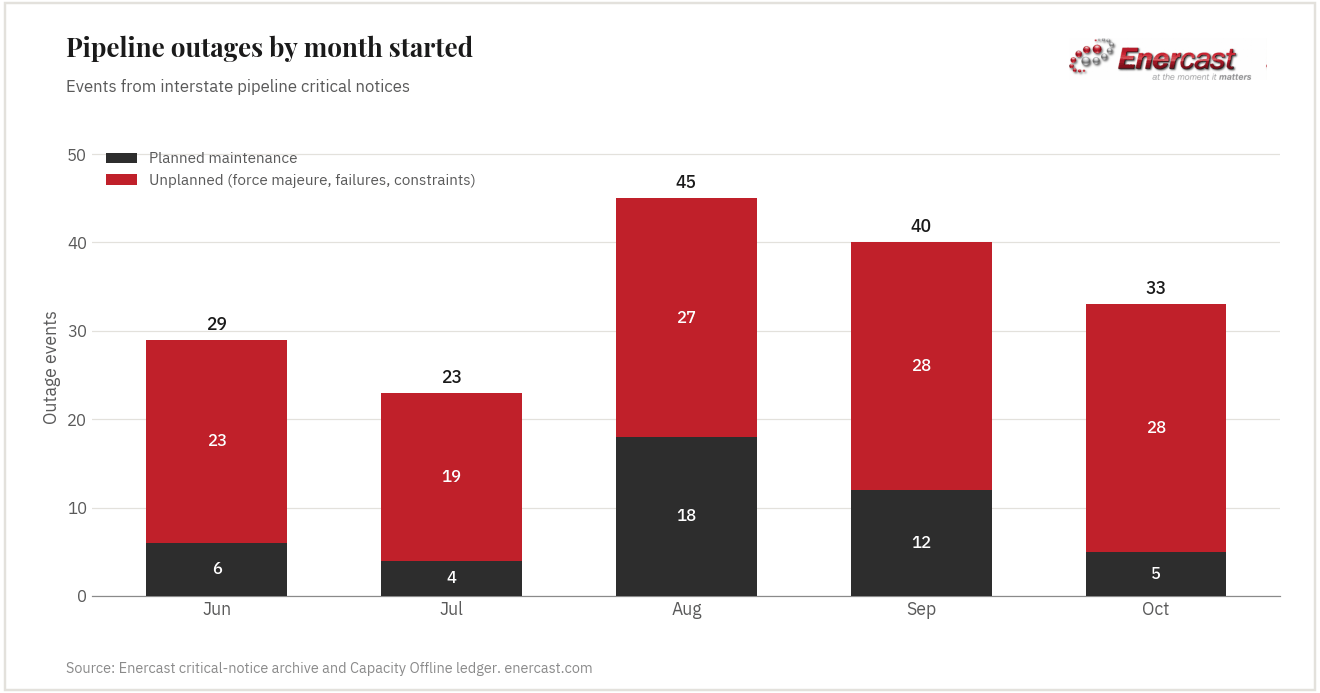
The pattern is the usual one. Pipelines do their heavy work — pigging, compressor overhauls, valve and line replacements — between the spring and fall shoulder seasons, when demand is low and lost capacity costs the least. Unplanned events don’t follow a calendar, and as the system runs harder into winter, each one matters more.
How much capacity is offline now
Since mid-October, Enercast’s Capacity Offline page has published a daily total of interstate pipeline capacity out of service. It peaked at 4.18 Bcf/d on October 28, when Gulf South had cut scheduling into Freeport LNG at Stratton Ridge and ANR’s Greenville compressor unit was down (an estimated 1.03 and 0.89 Bcf/d), and fell as low as 0.63 Bcf/d on November 2. It has been about 1.67 Bcf/d since November 5: 0.39 Bcf/d planned, from Columbia Gulf’s Hampshire compressor station work, and about 1.28 Bcf/d unplanned, most of it Transwestern’s force majeure on its Thoreau West system.
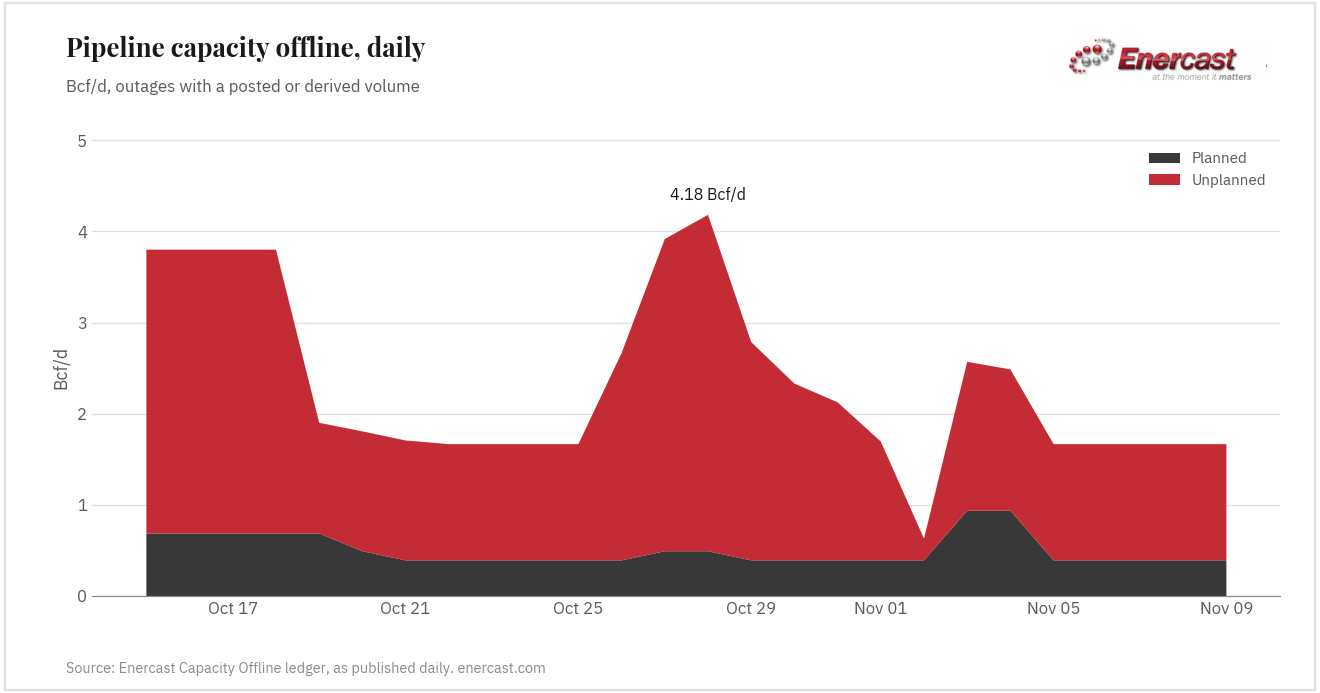
Those totals count only outages where the pipeline posted a volume or one can be derived from the notice and recent flows. Several current outages post a capacity limit but no lost volume — Gas Transmission Northwest’s flow past Kingsgate is capped at 2.8 Bcf/d after a compressor failure at Wallula, and Colorado Interstate Gas has Segment 164 Cheyenne West limited to 0.347 Bcf/d through year-end — so the daily figure is a floor, not the full picture.
Still in effect
| Pipeline | Location | Type | Since | Expected end | Bcf/d |
|---|---|---|---|---|---|
| Transwestern | Thoreau West system | Force majeure | Nov 3 | Nov 10 | ~1.12 est. |
| Columbia Gulf | Hampshire compressor station | Maintenance | Sep 9 | Nov 25 | 0.39 |
| Transwestern | East Mainline | Force majeure | Oct 27 | Nov 10 | 0.12 |
| Gas Transmission Northwest | Flow past Kingsgate (Wallula unit A) | Force majeure | Oct 30 | Nov 27 | capped at 2.8 |
| Colorado Interstate Gas | Segment 164 Cheyenne West | Force majeure | Oct 27 | Dec 31 | capped at 0.347 |
| Texas Eastern | Lebanon compressor station | Compressor issue | Aug 28 | Nov 25 | not stated |
| Great Lakes | Richfield | Capacity constraint | Oct 1 | Dec 1 | not stated |
| Nautilus | Enterprise Neptune plant | Force majeure | Sep 3 | Dec 2 | not stated |
Largest and longest-running outages from the Capacity Offline ledger; the page lists every one. “est.” = derived from recent flow; Transwestern’s Thoreau West notice states no reduced limit, so the full recent flow through the segment is counted as at risk.
What’s scheduled
Very little. As of November 9, pipelines have posted only a handful of planned outages for the rest of the year:
| Pipeline | Location | Dates | Bcf/d |
|---|---|---|---|
| Sabine Pass LNG | Gillis compressor station | Nov 12–21 | 0.40 |
| Columbia Gulf | Hampshire compressor station | through Nov 25 | 0.39 |
| ANR | Southwest Mainline capacity reduction | through Dec 18 | not stated |
| Trunkline | Kountze compressor station | Dec 8–9 | not stated |
As posted on pipeline bulletin boards by November 9. Pipelines can add maintenance at short notice.
What it means heading into winter
With most maintenance finished, pipeline capacity is not the constraint it was in August, just as heating demand starts to build. That does not by itself mean more gas will flow: supply depends on producers, and early November has gone the other way, with Appalachian and Haynesville receipts down after month-turn curtailments (see that story). And winter brings its own outages — compressor trips and freeze-offs — so the unplanned count is the one to watch.
How we count: an outage is one event in Enercast’s capacity-offline ledger, which groups a pipeline’s original notice, updates and lift into a single record and assigns it to the month it started. Planned = maintenance notices; unplanned = force majeure, compressor failures and capacity constraints (two September events and one October event were hurricane-related and are counted as unplanned). Volumes are shown from October 15, the first full day after Enercast began quantifying each outage daily (October 14); volumes marked est. are derived from recent flow and the posted limit.
Where this data comes from
The figures in this story come from Enercast’s critical-notice archive — every notice posted on the interstate pipeline bulletin boards we monitor, scored and grouped into outage events. You can follow them yourself:
- Capacity Offline — today’s offline capacity, the outage calendar and map
- Critical Notices — every notice, scored 1–5
- How Capacity Offline works — stated, derived and estimated volumes
- Daily Supply & Demand summary — all eight categories, free on the website daily by 7:30 AM ET
- How the numbers are built — posted quantities, not estimates
Sources: Enercast critical-notice archive (interstate pipeline bulletin boards) · Enercast Capacity Offline ledger. Not investment advice; see the disclaimer.